

 PDF
PDF Citation
 Print
Print


INTRODUCTION
Sodium is an essential electrolyte for regulating blood volume and osmotic equilibrium in the human body. However, high sodium intake leads to fluid retention and subsequent increase in blood pressure. Animal research has demonstrated that increased sodium intake could result in volume overload and hypertension (1), and clinical studies have shown that high sodium intake is closely associated with elevated blood pressure (2). Hypertension is a risk factor for cardiovascular disease and one of the leading causes of mortality in the general population (3). Therefore, dietary sodium intake is considered to be a modifiable risk factor for the development of hypertension and cardiovascular disease, and the importance of salt restriction is emphasized in the general population, especially in patients with cardiovascular disease. The World Health Organization has emphasized salt reduction as one of the top three priorities for improving the global non-communicable disease crisis (4), and it is recommended that sodium intake be below 2 g/day to reduce blood pressure and the risk of cardiovascular disease, stroke, and coronary heart disease in adults (5). The 2010 Dietary Guidelines for Americans recommend that adults in general should consume no more than 2,300 mg of sodium per day; additionally, those who are 51 yr of age and older, African Americans, and those who have high blood pressure, diabetes, or chronic kidney disease should limit their intake to 1,500 mg of sodium per day (6). Indeed, a recent meta-analysis revealed the blood pressure-lowering effects of sodium restriction (7).
Despite the risks associated with high salt intake, general population consumes much more sodium than recommended. The average daily sodium intake of Americans aged 2 yr and older is more than 3,400 mg (8). In 2010, South Koreans consumed 4,878 mg of sodium on average, which is 2.4 times higher than the WHO recommended daily intake of 2,000 mg per day (9). Although it is recommended that patients with cardiovascular disease reduce their sodium intake, the actual amount of sodium consumed and the relationship between the amount of sodium consumed and blood pressure in those with cardiovascular disease have not been well investigated. The aim of this cross-sectional study was to evaluate the effects of dietary sodium intake on blood pressure in the general populations and in subjects with cardiovascular disease in Korea. We aimed to investigate whether the effects of high sodium intake on blood pressure would be the same or different among patients with or without cardiovascular diseases.
MATERIALS AND METHODS
Description of study subjects
This present study was performed based on data acquired from the fourth Korea National Health and Nutrition Examination Survey (KNHANES) conducted in 2009-2011. The KNHANES has been carried out periodically since 1998 to assess the health and nutritional status of the civilian Korean population. The number of patients after primary selection was 42,347. Patients (n=10,972) younger than 20 yr were excluded. Among the 31,375 adult patients, the amount of urinary sodium excretion could be calculated in 19,083, and these subjects were included in the final statistical analysis. High blood pressure was defined as systolic blood pressure above 140 mmHg or diastolic blood pressure above 90 mmHg. Patients with hypertension were defined as patients with high blood pressure or those currently taking antihypertensive medications. Patients with coronary heart disease were defined as patients who had a history of angina or myocardial infarction. Patients with cerebrovascular disease were defined as patients who had history of diagnosis or treatment of brain hemorrhage or stroke. Cardiovascular disease was defined as either coronary heart disease or cerebrovascular disease.
Study measurements
The amount of salt intake was estimated based on the amount of urinary salt excretion. In this study, the amount of salt excreted was calculated with the Tanaka equations using a random urine sample. Essentially, the amount of salt excreted was calculated by multiplying the urinary sodium and creatinine ratio by the 24-hr urinary creatinine excretion rate. The Tanaka equations are as follows: 24-hr urinary sodium excretion (mM/day)=21.98 × urinary sodium concentration/urinary creatinine concentration×(-2.04 × age + 14.89 × body weight [kg] + 16.14 × height [cm] - 2244.45)0.392 (10).
Statistical analysis
Statistical analyses were performed using the IBM SPSS software package, version 21.0 (SPSS Inc., Chicago, IL, USA). Continuous data are presented as the means and standard deviation, and categorical data are presented as frequencies. The amount of urinary sodium excretion was categorized into quartile categories according to the existence of cardiovascular disease. Comparisons of blood pressure across the urinary sodium excretion groups were performed using analysis of variance (ANOVA) methods for the primary analysis and analysis of covariance (ANCOVA) adjusting for age, sex, BMI, diabetes mellitus, hemoglobin levels, eGFR, and total cholesterol levels for the secondary analysis. Correlations between the 24-hr salt excretion and blood pressure measurements were identified using linear correlation methods. A comparison of salt excretion between the blood pressure groups was performed using ANOVA and ANCOVA. Finally, the risk of uncontrolled blood pressure according to the amount of salt excretion was investigated by univariate and multivariate logistic regression methods adjusting for age, sex, and body mass index. All analyses were sequentially performed in the total participants group and in the cardiovascular disease group. All tests were two-sided, and P values of < 0.05 were considered to be significant.
RESULTS
Participant characteristics
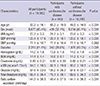
The clinical and laboratory characteristics of the participants are summarized in Table 1. A total of 19,083 adult participants were enrolled in this study. In the total participants group, the mean age was 50.2±16.1 yr, and 45.4% of the participants were male. The body mass index was 23.7±3.3. Systolic blood pressure was 120.4±17.6 mmHg, and diastolic blood pressure was 77.1±10.7 mmHg. The estimated urinary sodium excretion was 144.3±36.3 mM/day. The total number of patients with cardiovascular disease was 843 (4.4%). The mean age of the participants with cardiovascular disease was 65.3±10.5 yr; systolic blood pressure was 129.1±18.1 mmHg, diastolic blood pressure was 77.1±10.4 mmHg, and the estimated urinary sodium excretion was 149.4±37.5 mM/day. Compared to the patients without cardiovascular disease, the patients with cardiovascular disease were older with a male preponderance, high body mass index, high systolic blood pressure, high incidence of diabetes, high cholesterol levels, and decreased renal function. However, diastolic blood pressure did not differ between the two groups. The amount of urinary sodium excretion was significantly higher in the patients with cardiovascular disease (149.4±37.5 mM/day) than in those without cardiovascular disease (144.1±36.2 mM/day).
The relationship between blood pressure control and urinary sodium excretion
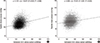
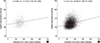
The correlation between urinary sodium excretion and blood pressure is illustrated in Fig. 1. Systolic blood pressure (Fig. 1A; β=0.107, P<0.001, R2=0.049) and diastolic blood pressure (Fig. 1B); β=0.045, P<0.001, R2=0.023) were significantly associated with the amount of urinary sodium excretion. The effect of comorbidities on the association between systolic blood pressure and the amount of urinary sodium excretion is illustrated in Fig. 2. Systolic blood pressure in the participants with cardiovascular disease (Fig. 2A; β=0.080, P<0.001, R2=0.028) and participants without cardiovascular disease (Fig. 2B; β= 0.107, P<0.001, R2=0.049) was associated with the amount of urinary sodium excretion.
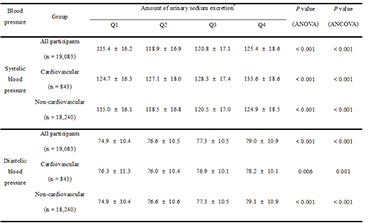
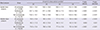
Systolic and diastolic blood pressure values were compared according to the amount of urinary sodium excretion (Table 2), and the amount of urinary sodium excretion was categorized into the quartiles in each group. In the total participants group, an increase in both systolic and diastolic blood pressure was associated with an increase in the amount of urinary sodium excretion. When the participants were compared according to the existence of cardiovascular disease, both systolic and diastolic blood pressure tended to increase in accordance with urinary sodium excretion in the participants with cardiovascular disease.
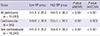
The amount of daily sodium excretion was compared according to blood pressure status (Table 3). The high blood pressure group included patients with systolic blood pressure at or over 140 mmHg or diastolic blood pressure at or over 90 mmHg. The low blood pressure group included patients with systolic blood pressure under 140 mmHg and diastolic blood pressure under 90 mmHg. The high blood pressure group showed an increased amount of urinary sodium excretion compared to the low blood pressure group (154.5±38.3 vs. 141.5±35.2 mM/day, P<0.001, in the total participants; 155.5±38.2 vs. 146.6±36.9 mM/day, P<0.001, in the patients with cardiovascular disease).
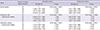
The prevalence of high blood pressure was analyzed with univariate and multivariate logistic regression methods (Table 4). In all groups, an increased amount of urinary sodium excretion was significantly associated with the development of hypertension. In the patients with cardiovascular disease, the odds ratio (OR) of high blood pressure was significantly higher (OR, 1.825; 95% CI, 1.187-2.807; P-for-trend 0.003, highest quartile of urinary sodium excretion vs. lowest quartile) in the multivariate analysis.
DISCUSSIONS
In this study, we investigated whether high sodium intake is closely associated with an increase in blood pressure, irrespective of comorbidities, in the Korean population. Both systolic and diastolic blood pressure were significantly associated with the amount of urinary sodium excretion, and the relationship was more evident for systolic blood pressure.
High sodium intake is an important cause of elevated blood pressure and is closely associated with cardiovascular events and mortality. The INTERSALT study showed that excessive sodium intake is related to high blood pressure, and the DASH-Sodium study reported that reducing the intake of sodium along with consuming a diet rich in fruits, vegetables, and low-fat dairy foods is effective for lowering blood pressure (2, 11). In addition, hypertension is one of the main risk factors for cardiovascular disease and mortality (12, 13), and high salt intake has a direct effect on the cardiovascular system, independent of its effects on blood pressure (14). Considering the risk and medical burden of cardiovascular morbidity and mortality in patients with cardiovascular disease, the importance of sodium restriction in this group is more important than sodium restriction in the general population. Although many clinical studies have explored the effect of dietary sodium intake on blood pressure in the general population, studies on patients with cardiovascular disease are lacking.
In the present study, the patients with cardiovascular disease were older, were predominantly male, and had higher systolic blood pressure with a higher amount of sodium excretion than the other participants. Age, sex, and body mass index are important factors influencing the blood pressure status and amount of salt intake. Therefore, we included these factors in our multivariate analysis and found that the amount of salt intake is significantly associated with systolic and diastolic blood pressure after adjusting for age, sex, and body mass index. In a recent meta-analysis, a modest reduction in salt intake for 4 or more weeks caused significant reductions in blood pressure in both hypertensive and normotensive individuals, irrespective of sex and ethnic group (15). Zhou et al. (16) found that the adoption of a diet low in sodium and high in potassium lowered systolic blood pressure in hypertensive patients and lowered both systolic and diastolic blood pressure in normotensive controls. Considering the effects of the amount of sodium excretion on systolic and diastolic blood pressure in the present study, we can conclude that both systolic and diastolic blood pressure are significantly associated with the amount of urinary sodium excretion, and this association does not differ regardless of the existence of cardiovascular disease.
In this study, the amount of urinary sodium excretion was estimated using the Tanaka equation with a spot urine sample. The amount of sodium intake is generally assessed by either the evaluation of dietary content or the measurement of urinary sodium excretion. However, because estimating sodium intake using food records or dietary recall questionnaires is cumbersome, a method for measuring urinary sodium excretion is preferred in clinical studies. The entire amount of ingested sodium is not excreted through urine, with approximately 10%-20% excreted via the gastrointestinal tract or as sweat (17); therefore, the amount of urinary sodium excretion is generally lower than the actual sodium intake (18). The gold standard method of measuring urinary sodium excretion is 24-hr urine collection and calculation of the amount of urinary sodium. However, 24-hr urine collection is inconvenient and can be inaccurate due to the possibility of missed urine samples. The Tanaka equation estimates 24-hr urinary sodium excretion by measuring the sodium to creatinine ratio from a spot urine sample obtained at any time from 9 AM to 7 PM (10). The Tanaka formula was generated using a database of Japanese subjects who participated in the INTERSALT study. Convenience and simplicity are the merits of the Tanaka equation; however, diurnal variation in urinary sodium excretion due to posture changes can introduce random error in measurements of 24-hr urinary sodium excretion. Although amount of urinary sodium excretion is closely associated with amount of dietary sodium intake, use of diuretics and its' dosage can affect the amount urinary sodium excretion. In this cross-sectional, it is a limitation that the diuretics usage could not be evaluated according to the urinary sodium excretion and blood pressure.
In the Korean population, patients with cardiovascular disease are assumed to consume an excess of sodium even though they are more hypertensive than the general population. The amount of urinary sodium excretion is closely related to the blood pressure level, irrespective of the cardiovascular disease status. Because high sodium intake is one of the main risk factors for hypertension and cardiovascular mortality, the importance of sodium restriction in patients with cardiovascular disease should be emphasized.
 XML Download