

 PDF
PDF ePub
ePub Citation
 Print
Print


The first pandemic H1N1 2009 patient in the Republic of Korea was confirmed by isolating the virus at the Korea Centers for Disease Control and Prevention (KCDC) on May 2, 2009 (1). In late May, the pandemic H1N1 2009 broke out among the group of trainee instructors at an English institute (2). After the nationwide spread of the virus, the National Disaster Phase was finally raised to "Severe (Red)"on November 3.
This report describes the pattern of the spread of the pandemic H1N1 2009 and we compare the number of reported patients with the number of antiviral prescriptions and with the number of influenza-like illness (ILI) among 1,000 visits, reported by the Korea Influenza Surveillance Scheme (KISS).
The pandemic H1N1 2009 was a notifiable communicable disease in Korea. Therefore, clinicians have reported to the National Infectious Diseases Surveillance System the data of all confirmed patients who were diagnosed as having H1N1 by conventional reverse transcriptase polymerase chain reaction (RT-PCR), real-time RT-PCR, or virus isolation through viral culture. The case definition of confirmed patients has slightly been revised 6 times depending on the spread of the virus.
The number of reported patients was organized on the basis of the reported date. In this article, the patients who were reported until the 57th week or January 31, 2010 were included. The 1st week was from December 28th, 2008 to January 3rd, 2009.
To reveal the spreading pattern according to age and the region, the confirmed patients were divided into several groups depending on their age and address. The number of patients and the incidence of pandemic H1N1 2009 in each group were evaluated according to time. The mid-year population (based on the residents' registration) was used for calculating the incidences (3). The mid-year population of 2009 was calculated by this formula; Mid-year population of 2009=(Population of December 31, 2009+Population of December 31, 2008)/2.
The surveillance of influenza in the KISS is based on reports made by private sentinel physicians, including pediatricians, internists and general practitioners and physicians in the county public health centers. Every Monday these physicians report the number of patients with influenza-like illness (ILI) and the total number of patients who visited for one week to the KCDC. ILI is defined as a fever (more than 38℃) with cough or sore throat. The number of sentinel clinics increased from 680 (1 clinic per 100, 000 persons) to 814 (1 clinic per 50,000 persons) in august 2009. Metropolitan cities, including Seoul with 151, had 354 sentinel clinics. Other provinces had 12 to 43 sentinel clinics except Gyeonggi-do with 169.
The KCDC developed a computer program in order to monitor the amount of used antivirals because all of these antivirals were part of those stockpiled by the government. This program was merged to the program of the National Health Insurance Corporation and it began operating on August 21, 2009 (the 34th week). The number of antiviral prescriptions was collected through this program. Actually, antiviral medication prescription criteria have changed several times, based on the amount of stockpiled antivirals, the spread of the virus, case fatality, and public opinion.
A total of 740,835 patients were reported to be infected with pandemic H1N1 2009 and 225 of them were reported to have died. The incidence was calculated as 1,492 per 100,000 population and the case fatality rate was 30 per 100,000 cases. Of them, 393,253 (53.1%) patients were male and 347,582 (46.9%) were female.
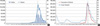
Fig. 1 shows the progress of the outbreak based on the reported cases. The first peak was at the 46th week, when 115,602 patients were confirmed. The second peak was at the 48th week, two weeks later after the first peak. More than 100 patients were newly confirmed at the 29th week and more than 1,000 patients were newly confirmed at the 35th week.
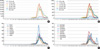
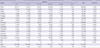
The age-determinant occurrence of patients (Fig. 2A) was evaluated. The patients were classified according to their ages as shown in Table 1. The number of patients aged from 7 to 12 was the largest (183,363 in total) and the number of patients over 65 was the smallest. The trend of incidence (Fig. 2B) showed that the virus spread and then was suppressed most quickly among the children between 13 and 18. The time of the first peak of each age group was same at the 46th week. However, in the group under six years of age, the second peak (the 48th week) was higher than the first peak.
The region-determinant incidence of patients was also evaluated (Fig. 2C, D). The first peaks were from the 45th week to the 47th week. Eight regions had one peak and the other eight regions showed two peaks. The lag time to the second peak ranged two to 10 weeks. It took seven weeks for Gangwon-do to show a second peak and 10 weeks for Chungcheongbuk-do to show a second peak. In Gyeonggi-do and Jeollabuk-do, the second peak (324/100,000 and 163/100,000, respectively) was higher than the first peak (243/100,000 and 160/100,000, respectively). In Ulsan metropolitan city, the peak at the 45th week was the highest at 563/100,000 and the epidemic continued for relatively longer.
In Fig. 1, the three graphs revealed a similar trend, but they were different in certain points. The peak of the ILI per thousand (44.96 per 1,000 visits) was at the 45th week, the number of antiviral prescriptions (610,378 cases among 3,214,034 in total) reached its peak at the 44th week, and the peak based on reported patients was the 46th week. In KISS, there are two peaks with a lag time of 3 weeks. The number of reported patients and the number of antiviral prescriptions have similar two peaks, which have a lag time of two weeks.
This is the first report on the whole trend of pandemic H1N1 2009 infection as assessed according to age and area. This report also describes three different methods of monitoring the outbreak. Though we could not obtain the exact size of pandemic H1N1 2009 outbreak, these three methods showed the trend of the outbreak by time.
The calculated incidence (1,492 per 100,000 populations) and the case fatality rate (30 per 100,000 cases) in this report are based on the reported confirmed patients. Because not all patients with ILI were confirmed by rRT-PCR, there must be missed patients who were infected with pandemic H1N1 2009. The real number of the pandemic H1N1 2009 patients must be even larger than the number of reported patients. Consequently, the case fatality rate must be decreased. Though there are some reports on the case fatality rate from other countries (4-6), it is impossible to directly compare our case fatality rate with that of other countries because every country has a different method to calculate the estimated cases.
The trend of incidence was used in analyzing the pattern of outbreak. Though the absolute number of patients is important in estimating the size of the outbreak, the absolute number of patients in each age group and each region can not exactly reflect the status of the occurrences because the populations in each age group and region are different from each other. To solve this problem, we compared the trend of incidence in each group.
During epidemic years, the influenza attack rate often exceeded 40% in preschool children and 30% in school age children (7). School age children are the main source of spreading influenza into households. In 2009 epidemic, the number of patients and the incidence of school age children (seven to 12) were highest at 183,363 patients and 4,927/100,000, respectively. This age group made up 25% of all the patients. Though the peak time and the trend of incidence in the group of school age children were similar to those in the other age groups, the incidence increased and decreased most quickly among the children between 13 and 18. This trend could be explained by the contact and mixing pattern of these school age children. The individuals in all the age groups tend to mix assortatively (i.e., preferentially with others of a similar age), but this pattern is most pronounced in those aged 5-24 yr (8).
The regional differences in the trend of the epidemic are not easily explained. First we assumed the demographic structure of these regions or population density might cause these differences. However, there was no coherent pattern by these two criteria. The reason for the different pattern by region needs further evaluation.
The KCDC monitored the epidemic in three ways: 1) the reporting system for notifiable infectious diseases, 2) KISS, and 3) the antiviral prescriptions. The ILI per thousand in KISS showed only the trend. As antivirals were prescribed to all patients with acute febrile respiratory illness, the number of antiviral prescriptions seemed to overestimate the size of outbreak.
As a result, only the trends were compared. The trends from these 3 methods are generally similar but different in detail, such as the peak time. These differences seem to come about due to the method of data collection. While the number of confirmed patients has a time lag from the onset of symptom to the reporting time, the amount of antiviral prescriptions was collected on the day of prescribing the drugs. In addition, the ILI per thousand dealt with patients with ILI, but the antivirals were prescribed to all patients who had an acute febrile respiratory illness.
As of February 3 2010, the outbreak passed through the peak and has gradually subsided. Now it is time for the government and the academic world to review this outbreak. The efficacy of vaccination, which began on October 27, should be evaluated as well. A complete review and evaluation would be helpful for the preparation and response for the next pandemic.
 XML Download