

 PDF
PDF ePub
ePub Citation
 Print
Print


INTRODUCTION
Insulin resistance (IR) is an important risk factor for the development of atherosclerosis and diabetes and also associated with obesity and the metabolic syndrome (MetS). Although the link between IR and obesity is not completely understood, recent findings suggest that a variety of fat-derived factors regulate IR (1). Among them, resistin has been suggested to decrease insulin sensitivity in vitro and in vivo in rodent animal models (2).
Resistin was cloned in 2001; it is a thiazolidinedione (TZD)-regulated cytokine expressed in adipose tissue (2). In animal studies, resistin has been shown to influence hepatic glucose and lipid metabolism (3, 4), and appears to be a major determinant of hepatic IR induced by a high-fat diet (5). However, the data on resistin in humans is conflicting. Some reports have shown that resistin levels are elevated in individuals with obesity and diabetes (6-8), whereas other investigators have not confirmed these findings (9-11). These conflicting findings reflect variations in the study design and experimental conditions, but more importantly they may reflect the lack of adjustment for potential confounding factors such as gender, ethnicity, degree of obesity, and differences in fat distribution. Moreover, the role of the body fat mass and distribution in determining the plasma levels of resistin has not yet been studied in humans.
The aim of this study was to determine the plasma levels of resistin in healthy subjects and subjects with MetS. In addition, the correlation of resistin levels with clinical, laboratory, including the index of IR and determinants of MetS, and anthropometric parameters were evaluated.
MATERIALS AND METHODS
One hundred and twenty Korean men and 180 women, who did not take any medication at the time of the study, and who have no known major illness, were recruited to participate in this study from 2005 through 2006. The institutional review board at the health promotion center at Ilsan-Paik Hospital in Korea approved the study protocol according to the Declaration of Helsinki. All subjects provided written informed consent to participate in the study.
Subjects completed a self-administered questionnaire that included demographic characteristics, general health status, smoking history, and current medications. Anthropometric and body composition measurements including heights, waist and hip-circumference were performed in all study participants before breakfast, with the subject wearing light clothing and without shoes. Their body mass index (BMI, kg/m2) was calculated as an index of their overall adiposity. The waist circumference was measured midway between the inferior margin of the last rib and the crest of the ileum in the horizontal plane. Hip circumference was measured around the pelvis at the point of maximal protrusion of the buttocks. The circumference was measured to the nearest 0.1 cm. Blood pressure (BP) was measured from the right arm subsequent to the participant sitting at rest for a period of 20 min. The mean of two consecutive blood pressure recordings was used for statistical analysis. The total body fat and muscle were then measured by bioimpedance analysis (Inbody 3.0, Biospace, Seoul, Korea). One observer performed all of the anthropometric and blood pressure measurements.
The total cross-sectional abdominal fat and abdominal visceral tissue (VAT) areas were measured by computed tomography (CT) scans (Somatom Plus 4, Siemens, Forchheim, Germany) using an established protocol (12). A cross-sectional scan, with 10-mm thickness centered at the L4-L5 vertebral disc space, was obtained with the subject in the supine position using a radiograph of the skeleton as a reference; this was used to establish the position of the scans to the nearest millimeter. The abdominal subcutaneous tissue (SAT) area was calculated by subtracting the VAT area from the total area of adipose tissue. In addition, the body composition, including lean body mass and total body fat, was determined by a dual energy absorptiometry (DXA; QDR 4500, Hologic, Bedford, MA, U.S.A.) performed with a whole-body scanner. The trunk fat was determined as the amount of fat measured by the DXA from below the neck to the pelvis, excluding the limbs.
Blood samples were collected from all subjects after an overnight fast (10 hr) between 0830 and 1030 hr, and the sera were stored at -70℃ until used. Fasting plasma glucose and lipids were measured enzymatically using an autoanalyzer (Hitachi 747, Hitachi Ltd., Tokyo, Japan). The plasma insulin levels were measured by radioimmunoassay (Hitachi E170, Hitachi Ltd.). The resistin was measured as previously described (7) and means of duplicated values were used in analysis. The IR index calculated from the fasting plasma insulin and the plasma glucose levels was estimated by the homeostasis model assessment (HOMA) where (13): HOMA=fasting plasma insulin (lU/mL)×fasting plasma glucose (mM/L)/22.5. The presence of the MetS was determined according to the 2005 revised National Cholesterol Education Program (NCEP) Adult Treatment Panel III criteria (14). We defined central obesity as a waist circumference ≥90 cm for men or ≥80 cm for women as recommended by the revised NCEP criteria.
Statistical analysis
SPSS 12.0 software (SPSS Inc., Chicago, IL, U.S.A.) was used for statistical analysis. A P less than 0.05 were considered statistically significant. Several variables were logarithmically transformed to obtain a normal distribution. We used the independent-t tests to analyze differences in the body composition and biochemical parameters between gender and between subjects without the MetS and those with the MetS. We calculated partial correlation analysis and then performed multiple linear regression analyses. Analyses were controlled for potential confounders including age and gender. We used a one-way ANOVA with post hoc analysis to assess for differences along the quartile hsCRP levels and the tertile of abdominal SAT.
RESULTS
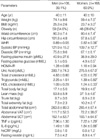
After exclusion of six subjects (3 men and 3 women), because of incidentally detected diabetes, the analysis was restricted to 276 subjects (aged from 19 to 70 yr, mean 40±11 yr, men=108 and women=168) for whom resistin data was available. BMI ranged from 17.6 to 33.2 kg/m2, with a mean value of 24.3±3.0 kg/m2. Table 1 summarizes the demographic, anthropometric and metabolic parameters of subjects enrolled in this study. The mean BMI was 25.3±2.6 kg/m2 in men and 23.7±3.0 kg/m2 in women. The finding of obesity was higher in men (54.6%: n=59, compared to women, 28.6%; n=48, P<0.001). The waist circumference, waist-hip ratio (WHR), systolic and diastolic blood pressure, fasting plasma glucose, uric acid, total cholesterol, and triglyceride were significantly higher in men compared to women. The HDL-cholesterol was lower in men compared to women. In addition, all anthropometric parameters were significantly higher in men compared to women, except for the total abdominal fat measured by CT and the fat mass in the trunk area measured by DXA. The plasma levels of TNF α, and high-sensitive C-reactive protein (hsCRP) were higher in men, but resistin was higher in women. Log transformed IL-6 level was significantly higher in women compared to men (-0.20±1.4 vs. 0.41±0.83, P<0.01). There were no significant differences between men and women in fasting glucose, insulin and HOMA-IR.
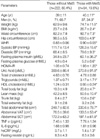
The clinical, laboratory and anthropometric parameters were compared between subjects without MetS (80.4%, n=222) and those with MetS (19.6%, n=54) (Table 2). As expected, all values of metabolic and anthropometric parameters were significantly different between the two groups. However, the plasma levels of resistin were not significantly different in comparisons between these two groups (8.3±4.3 vs. 8.5±3.6 ng/mL, respectively, P=0.278). The plasma levels of retinol binding protein 4 and hsCRP were significantly increased in subjects with MetS compared to those without MetS (52.4±20.1 vs. 64.3±26.2 µg/mL, 0.8±2.0 vs. 1.4±1.3 mg/L, respectively, P<0.01). The plasma levels of TNF α and log transformed IL-6 were increased in subjects with MetS but the differences did not reach statistical significance. In addition, adiponectin was increased in subjects without MetS but not in those with MetS (9.1±7.0 µg/mL vs. 5.2±3.5, respectively, P<0.001).
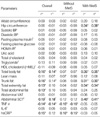
In order to evaluate potential relationships between plasma levels of resistin and clinical, laboratory and anthropometric parameters, we performed a correlation analysis (Table 3). The plasma resistin levels were significantly correlated with the age of subjects (Pearson's correlation coefficient, r=0.15, P=0.019) and increased in women. Thus, the correlation of resistin levels with other metabolic and anthropometric parameters was investigated with a partial correlation analysis adjusted for age and gender. We observed that the plasma levels of resistin were positively correlated with fat mass, measured by in-body impedance (data not shown), fat CT or DXA, especially with the fat mass in the extremities (r=0.13, P< 0.05) and the abdominal SCT (r=0.19, P<0.01). In addition, resistin was significantly correlated with the hsCRP (r=0.15, P<0.05). However, resistin was negatively correlated with the plasma levels of TNF α(r=-0.14, P<0.05). Furthermore, the plasma levels of resistin did not show any significant correlation with the BMI (r=0.09, P=0.152), waist circumference, waist-to-hip ratio, systolic and diastolic BP, plasma glucose, total cholesterol, triglycerides, and HDL-C (Table 3). Moreover, no correlation of plasma levels of resistin was noted to be associated with the levels of fasting plasma insulin and HOMA-IR. As well, plasma levels of IL-6, RBP4, adiponectin, and leptin were not significantly correlated with plasma resistin. After adjustment for obesity by BMI, these relationships remained significant, except for the total abdominal fat and fat mass in the extremities (Table 3). When a partial correlation analysis were performed in subjects without MetS, the plasma levels of resistin were positively correlated with the plasma hsCRP levels (r=0.16, P<0.05) and negatively correlated with the TNF α(r=-0.16, P<0.05). These observations remained significant after adjustment for BMI. In subjects with MetS, plasma levels of resistin were positively correlated with the hip circumference, total body fat, trunk fat, extremity fat, leptin and strongly correlated with abdominal subcutaneous adipose tissue (SCT) (Table 3).
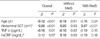
We performed a multiple linear regression analysis including the parameters, which were significantly correlated with the plasma resistin levels in all subjects and in subjects with/without MetS (Table 4). In this analysis, we included only abdominal SCT because of the interdependence and multicolinearity among the variables associated with measurements of body fat mass. The results of this analysis showed that age (β=-0.20, P<0.01), abdominal SCT (β=0.26, P<0.01) and TNF α(β=-0.16, P<0.01) in all subjects; age (β=-0.19, P<0.01), abdominal SCT (β=0.20, P<0.05), TNF α(β=-0.16, P<0.05), and hsCRP (β=0.16, P<0.05) in subjects without MetS and only abdominal SCT (β=0.57, P<0.01) in subjects with MetS were independent predictors of plasma resistin levels.
Fig. 1 shows that the plasma levels of resistin increased with hsCRP levels and abdominal SCT in subjects without MetS, however in the second and third tertile of the abdominal SCT, plasma levels of resistin were not significantly different with increases in hsCRP levels.
DISCUSSION
We present one of the first human studies on the plasma levels of resistin associated with anthropometric parameters. The results showed no evidence supporting a role for plasma resistin in mediating visceral obesity or IR in individuals with the MetS. However, potential associations between resistin and markers of systemic inflammations, such as hsCRP were found even in metabolically stable and healthy individuals.
Circulating resistin levels were found to be elevated in genetic (ob/ob and db/db) and diet induced models of obesity (2). Thiazolidinedione (TZDs), which lower IR by binding to peroxisome proliferators activated receptor-γ(PPARγ) receptors, decreased resistin levels in ob/ob mice and diabetic fatty rats. Tissue-cultured murine adipocytes treated with TZDs decreased resistin mRNA expression (2, 15). However, other studies have not supported a role of resistin in mediating IR in rodents. TZD treatment increased resistin expression in both lean and obese rodents, including ob/ob mice and Zucker diabetic fatty rats (16, 17); and resistin expression was increased by 66% in db/db mice treated with metformin (18). Additionally, resistin gene expression in 3T3-L1 adipocytes was inhibited by insulin and TNF α, which are increased in obesity (19, 20). Consistent with these findings, our results showed that the plasma resistin levels had a inverse relationship with plasma TNF α.
Plasma levels of resistin, produced by adipose tissue, might be present at high circulating levels in subjects with high fat content. In human, evidence in accumulating that resistin expression is high in mononuclear blood cells and other non-adipocytes of adipose tissue than in adipocytes them selves (20, 21). Therefore, absolute plasma levels of resistin were increased with generalized obesity and its relationship with clinical parameters of visceral obesity was not be linear; this could explain some of the inconsistent findings in human studies (20). Although previous reports showed that resistin mRNA was higher in visceral fat than in subcutaneous fat (22), our data suggests a possible significant association between circulating resistin levels and total fat mass or subcutaneous fat in humans.
As shown here, the impact of resistin may be more important in the regulation of the inflammatory process even in the lean subjects (23). After adjustment for abdominal SCT, gender and age, the partial correlation analyses showed that the plasma levels of resistin were associated with hsCRP (r=0.15, P=0.040) in subjects without MetS. These findings suggest that resistin may play a role in inflammation and could be a potential marker for systemic subclinical inflammation in obesity (24-27). Shetty et al. (11) described a positive association between resistin and CRP independent of BMI and gender. Thus, these observations suggest that inflammatory factors are more dominant determinants of plasma resistin levels than metabolic factors. Further studies are needed to clarify the role of resistin in obesity.
In summary, these results show that the resistin levels are not associated with markers of IR and/or central obesity. However, the resistin levels are associated with the total body fat mass and with markers of systemic inflammation in lean healthy subjects. However, because of this cross-sectional study design, we cannot suggest any causal or temporal relationship. Further investigations are needed to improve our understanding of resistin in humans.

 XML Download