

 PDF
PDF ePub
ePub Citation
 Print
Print


INTRODUCTION
Obesity is a well-known risk factor for cardiovascular disease, based on the findings of large-scale epidemiological studies. Genetic factors, a sedentary lifestyle, high salt intake, and excessive alcohol consumption are also known risk factors. Researchers have therefore recommended weight reduction, low salt intake, regular exercise, a moderate amount of alcohol consumption, and adequate calcium intake as primary interventions to prevent hypertension (1).
Most subjects of previous cohort studies have been Caucasians (2-5), but for a few studies the subjects were Asians who had a relatively lean body mass. There are different diagnostic criteria for a diagnosis of obesity in Asia-Pacific populations (6).
Several studies showed that obesity was also a significant risk factor for hypertension among Asian populations, but the definitions of obesity used in those studies were quite different from the definitions in the studies in which the subjects were caucasians. Reed et al. (7) studied the biological factors influencing systolic and diastolic blood pressure among elderly Japanese men who lived in Hawaii. Masaki et al. (8) also investigated the relationship between body mass index and blood pressure among Japanese men living in Hawaii. Some studies have been conducted in south China to investigate the cardiovascular risk factors of a lean population (9, 10). Most of these were cross-sectional studies that investigated different indices of obesity as a risk factor for hypertension. Bae and Ahn (11) conducted a nested case-control study on risk factors for hypertension in healthy, middle-aged Korean men using the database of the Korean Medical Insurance Corporation. The study prospectively examined the effect of obesity and other risk factors on the development of cardiovascular disease among Korean adults, however, the subjects were confined to men.
The present retrospective cohort study was the first to evaluate the effect of obesity on the incidence of hypertension among Korean men and women and to ascertain the level of obesity at which the incidence of hypertension increases significantly.
MATERIALS AND METHODS
Study subjects
The original cohort was established in 1991 for an ongoing study on the risk factors for chronic diseases, including hypertension and diabetes, in Seoul, Korea. A total of 4,876 adults, aged 17 to 80 yr, who had a medical examination from June 1990 to February 1991 at a health promotion center of Asan Medical Center, located in Seoul, were included as initial cohort subjects. Among them, 7 foreigners, 458 subjects who did not respond to the health risk questionnaire, 33 subjects whose medical records were lost, and 102 subjects who already had diagnosed hypertension before 1990 were excluded. Additionally, 350 subjects whose systolic blood pressure (SBP) were same as or above 160 mmHg or whose diastolic blood pressure (DBP) were same as or above 95 mmHg on the day of the examination were also excluded. In the initial selecting step, we used World Health Organization (WHO)'s diagnostic criteria for hypertension, which defined hypertension as systolic blood pressure were same as or above 160 mmHg or diastolic blood pressure were same as or above 95 mmHg. In most of the large scale epidemiologic studies conducted in Korea during the early 1990s, WHO's diagnostic criteria for hypertension were used (15, 16).
Nineteen subjects who were diagnosed as hypertensive within 1 yr of the initial medical examination were also excluded, because they might have been hypertensive at the time of the initial examination. According to such inclusion and exclusion criteria, we selected 3,788 adults.
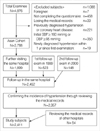
We reviewed medical records from April to June 2000 and found that 1,899 subjects had visited the same hospital more than twice. All of the 3,788 subjects were sent mail on March 1999 to get a follow-up examination. Among them, 523 subjects responded and had a first follow-up examination from April to May 1999. Subjects who had not visited the same hospital within 10 yr were again sent mail to get a follow-up examination, and 148 subjects had follow-up examinations in May 2000. Informed consent was obtained from each subject at the time of the follow-up examination. We tried telephone interviews with the subjects whose current blood pressure status was not known through all of these methods. We excluded subjects who had had no kind of follow-up visit or for whom the final visit was within 1 yr of the baseline medical examination. We finally defined a total of 2,411 subjects as the Asan retrospective cohort, who had had more than 1 follow-up visit and whose blood pressure status after at least 1 yr from the baseline examination were assessed by physicians. The selection process is illustrated in Fig. 1.
Baseline measurements
The baseline medical examination included a medical history, physical examination, anthropometric measurements, collection of blood samples for laboratory analysis, and a health-risk appraisal questionnaire. The questionnaire was completed by self-administration, and it consisted of 63 questions; 3 questions on socioeconomic status, 13 questions on family history of chronic diseases, 13 questions on past medical history, 4 questions on smoking information including smoking frequency, amount, duration and attempt to quit, 13 questions on drinking information including frequency and average drinking amount of beer, whisky, wine, and 3 kinds of traditional Korean alcoholic beverage, soju, makgulri, and jungjong, 9 questions on drug history, 1 question on seat belt use, 1 question on dietary salt intake, 1 question on the frequency of moderate intensity of physical activity, 1 question on hepatitis B vaccination, 1 question on transfusion, 1 question on sleeping amount and 2 questions on social stress. Daily alcohol intake and smoking pack-year index were calculated from this questionnaire.
Anthropometric parameters, including height and weight, were measured with the subjects wearing light clothing and no shoes. The body mass index (BMI) was calculated as weight in kilograms divided by height in meters squared (kg/m2). Sitting blood pressure was measured twice by trained nurses using the left arm with a standard mercury sphygmomanometer and an average of the 2 measures was used in the analysis. SBP and DBP were defined as the points of the appearance and disappearance of Kortokoff sounds, respectively. After overnight fasting, blood samples were drawn from an antecubital vein for the measurement of serum lipid profile, fasting blood glucose, and other blood chemistries. The serum total cholesterol level was categorized into 3 groups; smaller than 200 mg/dL, 200-239 mg/dL, same as or greater than 240 mg/dL. We defined hyperglycemic group as subjects who had been already diagnosed as diabetes or taking oral hypoglycemic agents or insulin, or whose fasting blood sugar level was above 110 mg/dL.
Follow-up for diagnosing hypertension
Four family physicians reviewed twice all the medical records of the 3,788 subjects in January 1998 and May 2000. The incidence of hypertension was defined by the assessment of hypertension recorded by the physician or a report of pharmacologically treated hypertension at least 1 yr after the baseline medical examination for 1,210 subjects who voluntarily had a screening medical examination in the same health promotion center and 598 subjects who voluntarily visited outpatient clinic but did not have a screening medical examination or follow-up examination.
During the follow-up examinations which were conducted twice in 1998 and 2000, all examinees were interviewed by physicians, were measured their blood pressure by nurses at least twice, were drawn blood samples for laboratory examinations and filled out the health risk appraisal questionnaire. The examinees with history of being diagnosed with hypertension by physicians or taking antihypertensive drugs were defined as being hypertensive. The examinees who had never been diagnosed with hypertension, but measured mean systolic blood pressure was at or above 140 mmHg or measured mean diastolic blood pressure was at or above 90 mmHg, were also defined as being hypertensive. In those cases we used the criteria of the 5th report of the Joint National Committee of detection, evaluation, and treatment of high blood pressure (JNC V), because most physicians follow the JNC V guidelines to diagnose hypertension in clinical settings.
For the telephone interviews, subjects who were diagnosed by physicians, or who had ever been prescribed antihypertensive medications, were defined as being hypertensive.
We defined the earliest diagnosis of hypertension in the medical records or during the interviews as the event date and the latest hospital visit as the end of follow-up, from which we can confirm their blood pressure status through reviewing the medical records.
Statistical analysis
We initially classified subjects into 4 groups according to their BMI: smaller than 23.0 kg/m2, 23.0 to 24.9 kg/m2, 25.0 to 26.9 kg/m2, and greater than 27.0 kg/m2. Cox's proportional hazards model was used to assess the independent contributions of the individual risk factors to the subsequent hypertension, and to obtain relative risk adjusted for other risk factors. The assumption of proportionality underlying these regression models was confirmed by examining log-log plots. All significance tests were 2-tailed.
RESULTS
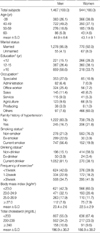
The general characteristics of the subjects are shown in Table 1. The mean age was 44.9 yr for men and 43.1 yr for women. After a mean follow-up period of 6.1 yr, there were 153 new cases of hypertension among the 1,467 male subjects. After a mean follow-up period of 6.3 yr, there were 81 new cases of hypertension among the 944 female subjects. The crude incidence rate of hypertension per 1,000 person-years of follow-up was calculated as 17.4 for men, and 13.9 for women.
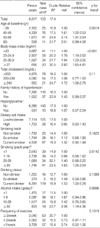
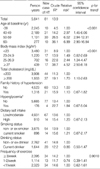
Table 2 shows the estimated incidence rates of hypertension according to variables, which for men increased with increasing age, except for 60 yr and over, BMI, total cholesterol level, smoking amount (pack-year index), and daily alcohol consumption. Table 3 shows that the incidence rate of hypertension for women increased with increasing age, BMI, and total cholesterol level. For women, smoking habits and alcohol consumption were not significantly related with hypertension. A family history of hypertension, dietary salt intake, and frequency of exercise were not significant risk factors for hypertension for either men or women.
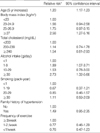
Table 4 shows the relative risks of hypertension for men in different categories of BMI after adjustment for age, total cholesterol level, family history of hypertension, frequency of exercise, daily alcohol consumption, and smoking pack-year. Compared with men who had a BMI smaller than 23 kg/m2, the adjusted relative risks of hypertension for men with a BMI 23-24.9, 25-26.9 kg/m2, and greater than 27 kg/m2 were 1.56 (95% CI, 0.94-2.58), 1.75 (0.97-3.15), and 2.56 (1.27-5.16), respectively. Age and alcohol consumption greater than 30 g per day were also significant risk factors for hypertension in men.
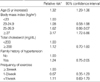
Table 5 shows the relative risks of hypertension for women in different categories of BMI after adjustment for age, total cholesterol level, family history of hypertension, and frequency of exercise. Compared with women who had a BMI smaller than 23 kg/m2, the adjusted relative risks of hypertension for women with a BMI 23-24.9 kg/m2, 25-26.9 kg/m2, and greater than 27 kg/m2 were 1.08 (0.58-1.98), 1.62 (0.86-3.07), and 3.17 (1.72-5.86), respectively. Age was another significant risk factor for hypertension, and with an age increase of 5 yr, the risk of hypertension increased 32%.
DISCUSSION
In this retrospective cohort study, we found a strong positive association between the BMI and the incidence of hypertension among Korean adults. After adjusting for possible confounding factors, the risk significantly increased in subjects with a BMI greater than 27 kg/m2, and was higher in women than in men. Age and alcohol consumption greater than 30 g per day were significant predictors of risk of hypertension in men. It is difficult to compare our study results with those from other studies because the reference value of each study was quite different. According to the results of the NHANES I epidemiologic follow-up study performed in the U.S., the odds ratios for men with a BMI greater than 27.3 kg/m2 and for women with a BMI greater than 27.8 kg/m2 compared with those who had a smaller BMI were 2.78 for black men, 1.64 for white men; and 1.84 for black women and 2.16 for white women (2). According to the result of the Nurses' Health Study, an increase in BMI 1 kg/m2 was associated with a 12% increase in risk of hypertension after 16 yr of follow-up (5), and the relative risk for women with a BMI 26-28 kg/m2 and a BMI 29-31 kg/m2 compared with women with a BMI less than 23 kg/m2 were 2.80 and 3.86 after 4 yr of follow-up (12). A prospective cohort study conducted in Japan also showed that the risk of hypertension was greatly increased in men with a BMI greater than 27 kg/m2 (13). A nested case-control study conducted in Korea reported that the odds ratio for middle-aged healthy men with a BMI greater than 25 kg/m2 was 2.89 (11). The present study showed results similar to those previous studies even though the reference values differed from each other.
Of the 3,788 baseline subjects, only 2,411 subjects (64%) were finally selected for this retrospective cohort study. We analyzed the general characteristics of 1,245 subjects who had never visited the same hospital or who had not had their blood pressure checked for 10 yr after the baseline examination. As the baseline BMI between the 2 groups did not show any statistical difference, we could exclude the possibility of a selection bias from the different rate of visiting hospital according to the different BMI distribution.
At the time of the baseline examination, a diagnosis of hypertension was based on the WHO criteria, which defined hypertension as a systolic blood pressure of greater than or equal to 160 mmHg, or a diastolic blood pressure of greater than or equal to 95 mmHg (14). Because we checked baseline blood pressure on the day of examination when subjects became more anxious and their blood pressure could be slightly increased, some normotensive subjects could have been classified as hypertensive. It is also possible that hypertensive subjects were classified as normotensive because their blood pressure level could have temporarily dropped. We excluded 19 subjects who were diagnosed as being hypertensive within 1 yr of their baseline examination to take account of these misclassification biases.
During the follow-up period, we used the criteria of the 5th report of the Joint National Committee of detection, evaluation, and treatment of high blood pressure (JNC V) for diagnosing incident hypertension, because most physicians follow the JNC V guidelines to diagnose hypertension in clinical settings. To evaluate the problems according to using different diagnostic criteria at baseline follow up examination, we excluded all subjects whose initial systolic blood pressure were above 140 mmHg or diastolic blood pressure were above 90 mmHg, and conducted the same statistical analysis for 1,195 male and 884 female subjects. The relative risks of hypertension with a BMI 25-26.9 kg/m2, and greater than 27 kg/m2 were 1.73 (1.04-2.88), and 2.32 (1.19-4.51) for men, and 2.43 (1.12-5.25), and 3.64 (1.63-8.15) for women. Those results were very similar with the results of this study.
We obtained the information on the incidence of hypertension using 3 different methods. The information from almost 70% of subjects who had a screening medical examination in the same hospital is probably valid because the diagnosis of hypertension was based on trained nurses checking blood pressure at least twice and physicians interviewing subjects for a detailed medical history, including a drug history. The information from 25% of subjects who did not have a screening or follow-up examination was based on the medical records of other departments of the same hospital, i.e., internal medicine, family medicine, neurology, general surgery, ophthalmology, and so on. Four family physicians thoroughly reviewed the medical records and defined the incidence of hypertension very carefully and only when they saw a recorded assessment of hypertension by doctors, or when prescriptions for antihypertensive drugs were written in the records. Subjects who had high blood pressure but were not assessed as hypertensive by physicians or had never taken antihypertensive medications, were not defined as incidences of hypertension. Regarding the telephone interviews, we defined hypertension by the same rule. The incidences of hypertension per 1,000 person-year were 17.8 in subjects who had follow-up examinations, 16.8 in subjects who visited only other departments of the same hospital, and 11.7 in telephone interview only subjects. The incidence of hypertension was slightly lower in subjects who had not visited the hospital for 10 yr and for whom the diagnosis of hypertension was totally dependent on a telephone interview, so we finally excluded those subjects for final analysis. But 77 subjects answered that they have ever got health examination in other hospitals, so we tried to review the medical records of other hospitals and could confirm the incidence of hypertension in additional 54 subjects.
Age was the most potent risk factor in both men and women. We found that an age increase of 5 yr increased the risk of hypertension by 20% in men and 32% in women. In the present study, the incidence of hypertension in men older than 60 yr was lower than in men 50-59 yr old, and these findings are different from other study results, which showed the incidence increasing constantly with age (11, 15-17). But some other studies have reported a lower incidence of hypertension in men in their 60s than in their 50s in the black population (2, 18). Further follow-up observation and other longitudinal studies that include older Korean men are required.
Several studies have reported a significant association between alcohol consumption and blood pressure, independent of the effects of age and body weight, with the risk of hypertension increasing when the level of alcohol consumption exceeded 3 to 5 drinks per day (2, 19-24). After adjustment for age and BMI, men who drank more alcohol than 30 g per day had a 2.7 fold increased risk of hypertension in this study, which is compatible with other study results. Regarding women, we could not attempt a quantitative analysis to observe the risk of hypertension according to alcohol amount because only 286 female subjects were current drinkers, and 95% of them drank less than 10 g of alcohol per day.
The association between hypertension and serum lipid profiles, i.e., total cholesterol, triglyceride, and HDL cholesterol varies in different studies. Some previous studies reported triglyceride was a predictor of hypertension, rather than total cholesterol or HDL cholesterol (4, 7), but another study reported all 3 measurements as independent determinants of hypertension (25). We only included total cholesterol level as a predictor variable, and did not observe a significant association with hypertension risk.
In the present study, glucose concentrations at baseline did not significantly predict hypertension. The blood glucose level or presence of diabetes mellitus was reported as predictors of hypertension in previous studies (7, 26, 27). But others failed to find an effect of impaired glucose tolerance on the risk of developing hypertension (4, 28). In this study, subjects who were diagnosed as diabetes mellitus, had controlled blood glucose level under 110 mg/dL, and did not answer the item of "history of diabetes" in the questionnaire were classified as "nondiabetic" so this misclassification bias possibly influenced the study results.
Physical activity or fitness was known to have a protective effect against developing of hypertension (20, 29, 30), but we failed to find a protective effect in this study. We estimated the level of physical activity from the single question, "How often do you exercise more than 20 min until you get short of breath or you sweat?", and this was insufficient for us to collect meaningful information. The crude estimation of physical activity and diet from the very simple self-reported questionnaire is one of the limitations of this study.
We estimated obesity with only one index, i.e., the baseline BMI, and did not account for adiposity or abdominal obesity, which are also known to be associated with hypertension (4, 31). We did not measure waist circumference, waist-hip ratio, or body fat distribution during the baseline examination, so we could not investigate the relationship between the incidence of hypertension and those factors. Recent studies have reported that weight change is also associated with hypertension independently of baseline obesity (5, 32-36). Even though 70% of subjects who had had a follow-up examination or screening health examination measured their body weight for every visit, we could not consider the weight change factor as an independent variable because almost 30% of subjects did not measure their body weight at the same hospital after the baseline examination. Further efforts will be required to evaluate those subjects in future long-term follow-up studies.
In conclusion, the results from a cohort of adult Korean men and women suggest that it is beneficial to maintain a BMI under 27 kg/m2 and restrict alcohol consumption to less than 30 g per day for the prevention of hypertension.
 XML Download