

 PDF
PDF ePub
ePub Citation
 Print
Print


Abstract
Background
Diabetes mellitus (DM) is characterized by impaired glucose regulation and various complications. It is known that chronic inflammation and platelet activation play a role in development of insulin resistance or diabetic complications. This study investigated whether hematologic parameters are useful for monitoring blood glucose regulation or complications in DM patients.
Methods
Total 90 diabetic patients were divided into two groups according to their hemoglobin A1c (HbA1c) levels: 59 regulated DM patients with HbA1c levels<7% and 31 unregulated DM patients with HbA1c levels≥7%.
Results
White blood cell counts (P=0.021), neutrophil counts (P=0.005), monocyte counts (P=0.040), neutrophil % (P=0.042) and the neutrophil lymphocyte ratio (NLR) (P=0.032) were significantly higher in the unregulated DM group compared to that in the regulated DM group. There were no differences in lymphocyte counts, lymphocyte %, monocyte %, mean neutrophil volume, mean monocyte volume, platelet count, and mean platelet volume between groups. Neutrophil counts and NLR were higher in unregulated DM patients with complications than in the regulated DM group. A positive correlation was observed between HbA1c and white blood cell count (r=0.389, P<0.001) and neutrophil count (r=0.361, P<0.001).
Conclusions
In DM patients, neutrophil counts and NLR were related to glycemic control and the presence of complications. Additionally, neutrophil counts showed a positive correlation with HbA1c. Therefore, neutrophil counts and NLR can be used as related markers for diabetic regulation and complications during the follow-up of diabetic patients.
Figures and Tables
Fig. 1
Differences in neutrophil count and neutrophil-lymphocyte ratio (NLR) among 4 groups with diabetes mellitus (DM).
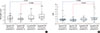
Table 1
Comparison of demographic and hematologic data between regulated DM group (HbA1c ≤7%) and unregulated DM group (HbA1c >7%)
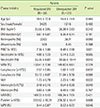
Table 2
Correlations between HbA1c and hematologic parameters
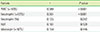
| Factors | r | P value |
|---|---|---|
| WBC (×109/L) | 0.389 | <0.001 |
| Neutrophil (×109/L) | 0.361 | <0.001 |
| Neutrophil (%) | 0.125 | 0.242 |
| NLR | 0.161 | 0.129 |
| Monocyte (×109/L) | 0.154 | 0.146 |
Abbreviations: See Table 1.
Table 3
Comparison of hematologic data between regulated DM patients and unregulated DM patients with and without microvascular complication
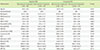
Abbreviations: See Table 1.
References
1. Shoelson SE, Lee J, Goldfine AB. Inflammation and insulin resistance. J Clin Invest. 2006; 116:1793–1801.

2. Pitsavos C, Tampourlou M, Panagiotakos DB, Skoumas Y, Chrysohoou C, Nomikos T, et al. Association between low-grade systemic Inflammation and type 2 diabetes mellitus among men and women from the ATTICA study. Rev Diabet Stud. 2007; 4:98–104.
3. de Rooij SR, Nijpels G, Nilsson PM, Nolan JJ, Gabriel R, Bobbioni-Harsch E, et al. Low-grade chronic inflammation in the relationship between insulin sensitivity and cardiovascular disease (RISC) population: associations with insulin resistance and cardiometabolic risk profile. Diabetes Care. 2009; 32:1295–1301.
4. Fujita T, Hemmi S, Kajiwara M, Yabuki M, Fuke Y, Satomura A, et al. Complement-mediated chronic inflammation is associated with diabetic microvascular complication. Diabetes Metab Res Rev. 2013; 29:220–226.
5. Ferroni P, Basil S, Falco A, Davi G. Platelet activation in type 2 diabetes mellitus. J Thromb Haemost. 2004; 2:1282–1291.
6. Lee AJ, Kim SG. Mean cell volumes of neutrophils and monocytes are promising markers of sepsis in elderly patients. Blood Res. 2013; 48:193–197.
7. Tong PC, Lee KF, So WY, Ng MH, Chan WB, Lo MK, et al. White blood cell count is associated with macro- and microvascular complications in chinese patients with type 2 diabetes. Diabetes Care. 2004; 27:216–222.
8. Imtiaz F, Shafique K, Mirza SS, Ayoob Z, Vart P, Rao S. Neutrophil lymphocyte ratio as a measure of systemic inflammation in prevalent chronic diseases in Asian population. Int Arch Med. 2012; 5:2.
9. Papanas N, Symeonidis G, Maltezos E, Mavridis G, Karavageli E, Vosnakidis T, et al. Mean platelet volume in patients with type 2 diabetes mellitus. Platelets. 2004; 15:475–478.
10. Hekimsoy Z, Payzin B, Ornek T, Kandogan G. Mean platelet volume in type 2 diabetic patients. J Diabetes Complications. 2004; 18:173–176.
11. American Diabetes Association. Diagnosis and classification of diabetes mellitus. Diabetes Care. 2013; 36:suppl 1. S67–S74.
12. Sefil F, Ulutas KT, Dokuyucu R, Sumbul AT, Yengil E, Yagiz AE, et al. Investigation of neutrophil lymphocyte ratio and blood glucose regulation in patients with type 2 diabetes mellitus. J Int Med Res. 2014; 42:581–588.
13. Sarraf KM, Belcher E, Raevsky E, Nicholson AG, Goldstraw P, Lim E. Neutrophil-lymphocyte ratio and its association with survival after complete resection in non-small cell lung cancer. J Thorac Cardiovasc Surg. 2009; 137:425–428.
14. Gibson PH, Croal BL, Cuthbertson BH, Small GR, Ifezulike AI, Gibson G, et al. Preoperative neutrophil-lymphocyte ratio and outcome from coronary artery bypass grafting. Am Heart J. 2007; 154:995–1002.
15. Chang FY, Shaio MF. Decreased cell mediated immunity in patients with noninsulin-dependent diabetes mellitus. Diabetes Res Clin Pract. 1995; 28:137–146.
16. Kahraman C, Yümün G, Kahraman NK, Namdar ND, Cosgun S. Neutrophil-to-lymphocyte ratio in diabetes mellitus patients with and without diabetic foot ulcer. Eur J Med Sci. 2014; 1:8–13.
17. Lou M, Luo P, Tang R, Peng Y, Yu S, Huang W, et al. Relationship between neutrophil-lymphocyte ratio and insulin resistance in newly diagnosed type 2 diabetes mellitus patients. BMC Endocr Disord. 2015; 15:9.
18. Gkrania-Klotsas E, Ye Z, Cooper AJ, Sharp SJ, Luben R, Biggs ML, et al. Differential white blood cell count and type 2 diabetes: systemic review and meta-analysis of cross-sectional and prospective studies. PLoS One. 2010; 5:e13405.
19. Xu W, Wu HF, Ma SG, Bai F, Hu W, Jin Y, et al. Correlation between peripheral white blood cell counts and hyperglycemic emergencies. Int J Med Sci. 2013; 10:758–764.
20. Chung FM, Tsai JC, Chang DM, Shin SJ, Lee YJ. Peripheral total and differential leukocyte count in diabetic nephropathy: the relationship of plasma leptin to leukocytosis. Diabetes Care. 2005; 28:1710–1717.
21. Ozder A, Eker HH. Investigation of mean platelet volume in patients with type 2 diabetes mellitus and in subjects with impaired fasting glucose: a cost-effective tool in primary health care? Int J Clin Exp Med. 2014; 7(8):2292–2297.
22. Ulutas KT, Dokuyucu R, Sefil F, Yengil E, Sumbul AT, Rizaoglu H, et al. Evaluation of mean platelet volume in patients with type 2 diabetes mellitus and blood glucose regulation: a marker for atherosclerosis? Int J Clin Exp Med. 2014; 7:955–961.
23. Varol E, Akcay S, Icli A, Yucel H, Ozkan E, Erdogan D, et al. Mean platelet volume in patients with prehypertension and hypertension. Clin Hemorheol Microcirc. 2010; 45:67–72.
24. Coban E, Afacan B. The effect of rosuvastatin treatment on the mean platelet volume in patients with uncontrolled primary dyslipidemia with hypolipidemic diet treatment. Platelets. 2008; 19:111–114.
25. Huang W, Huang J, Liu Q, Lin F, He Z, Zeng Z, et al. Neutrophil-lymphocyte ratio is a reliable predictive marker for early-stage diabetic nephropathy. Clin Endocrinol (Oxf). 2015; 82:229–233.
 XML Download