Abstract
Background
An in-training examination is given annually to the all laboratory medicine residents of in Korea. The purpose of this study was to evaluate the results of the in-training examinations according to the examinees' postgraduate years, a number of teaching faculty members and hospital beds, and the score of the board examination.
Methods
A total number of examinees during the 5-year period from 2001 to 2005 were 311. All residents took the same in-training examinations given each year irrespective of the postgraduate year (PGY).
Results
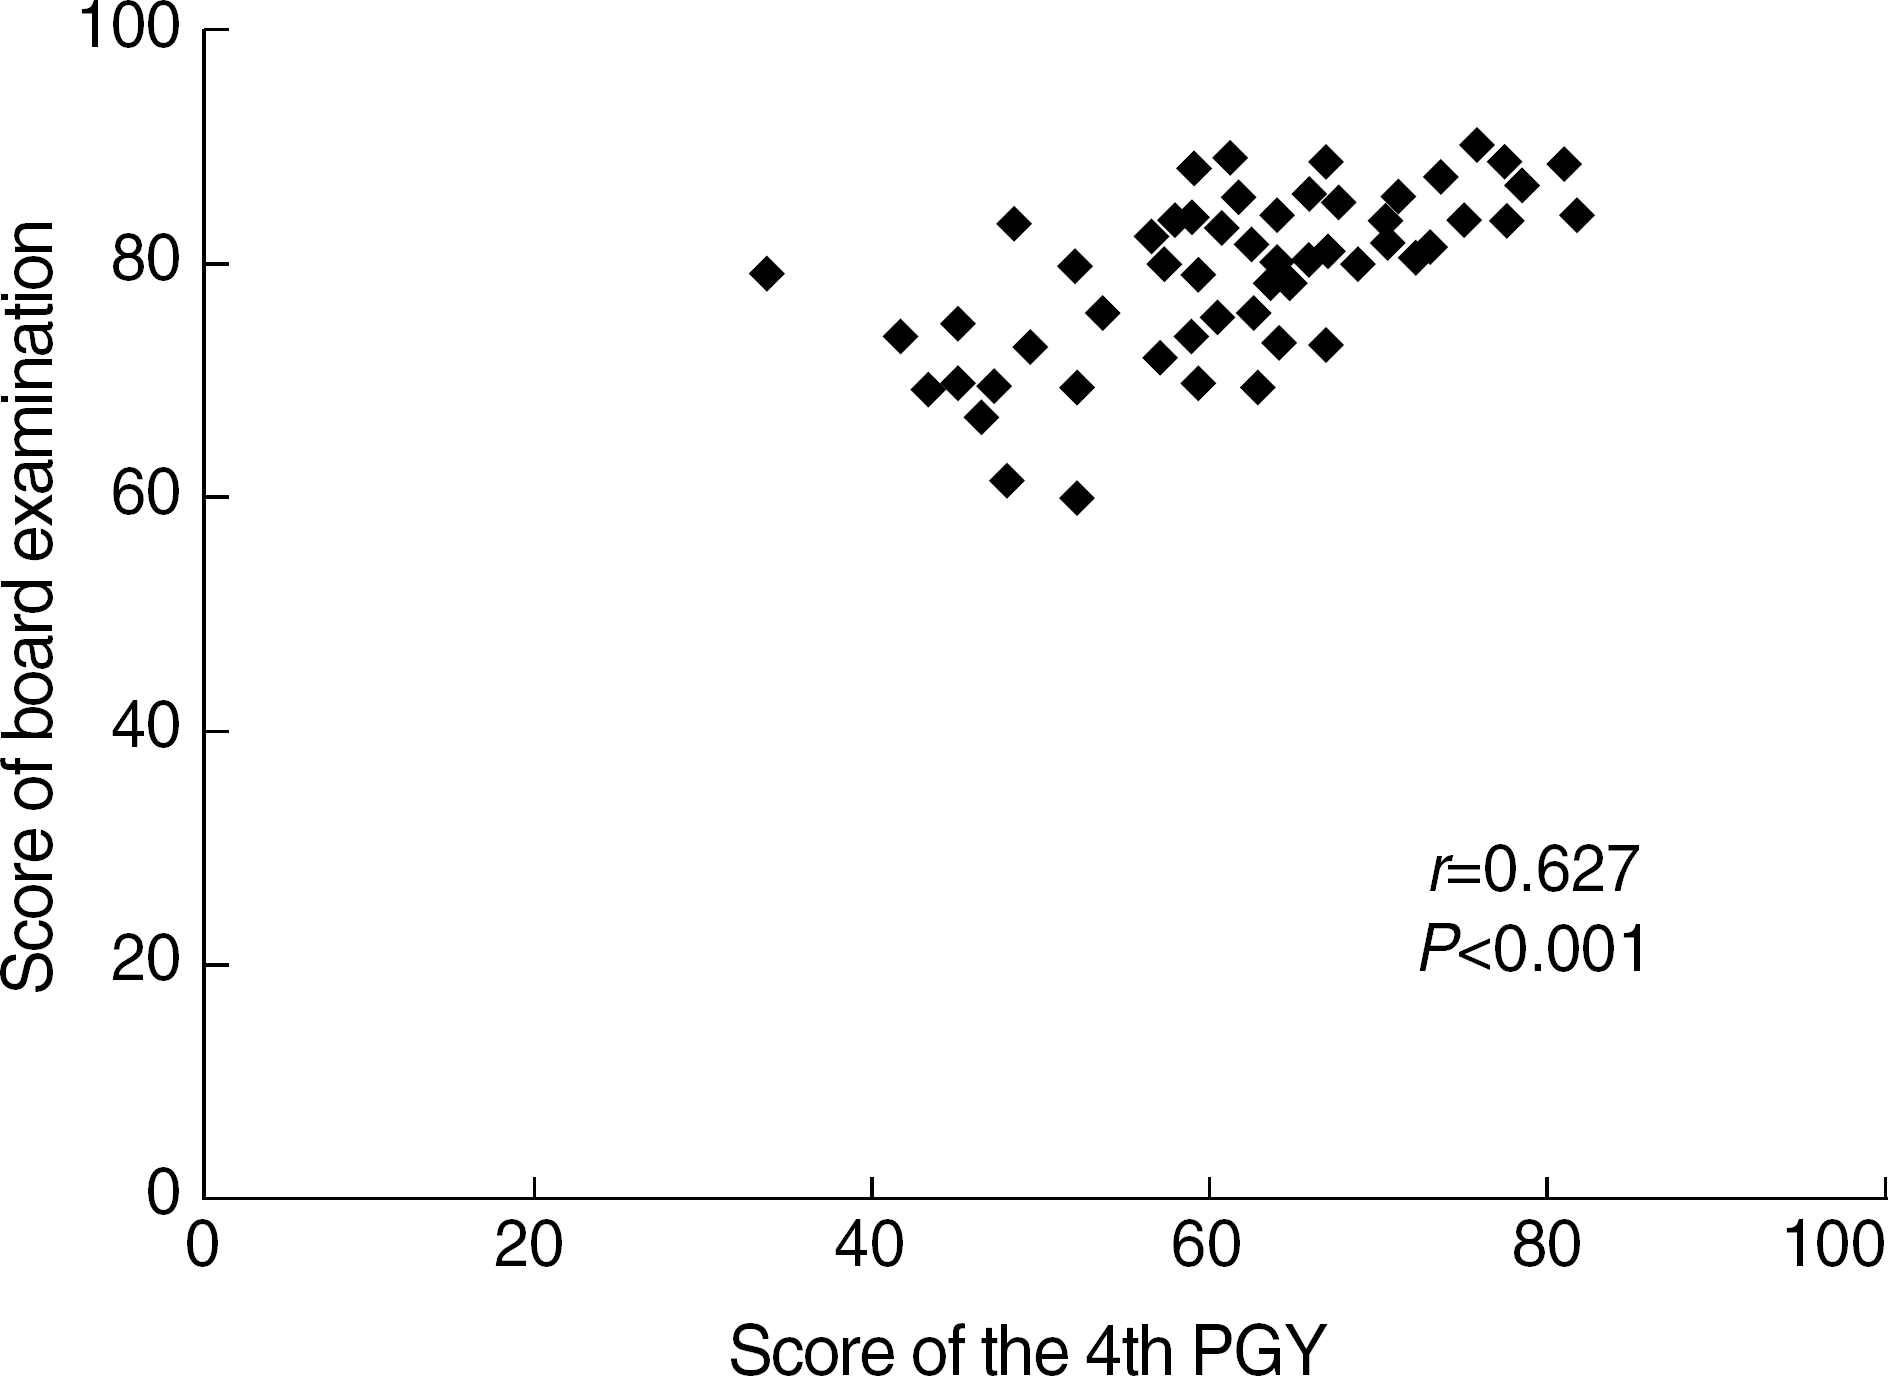
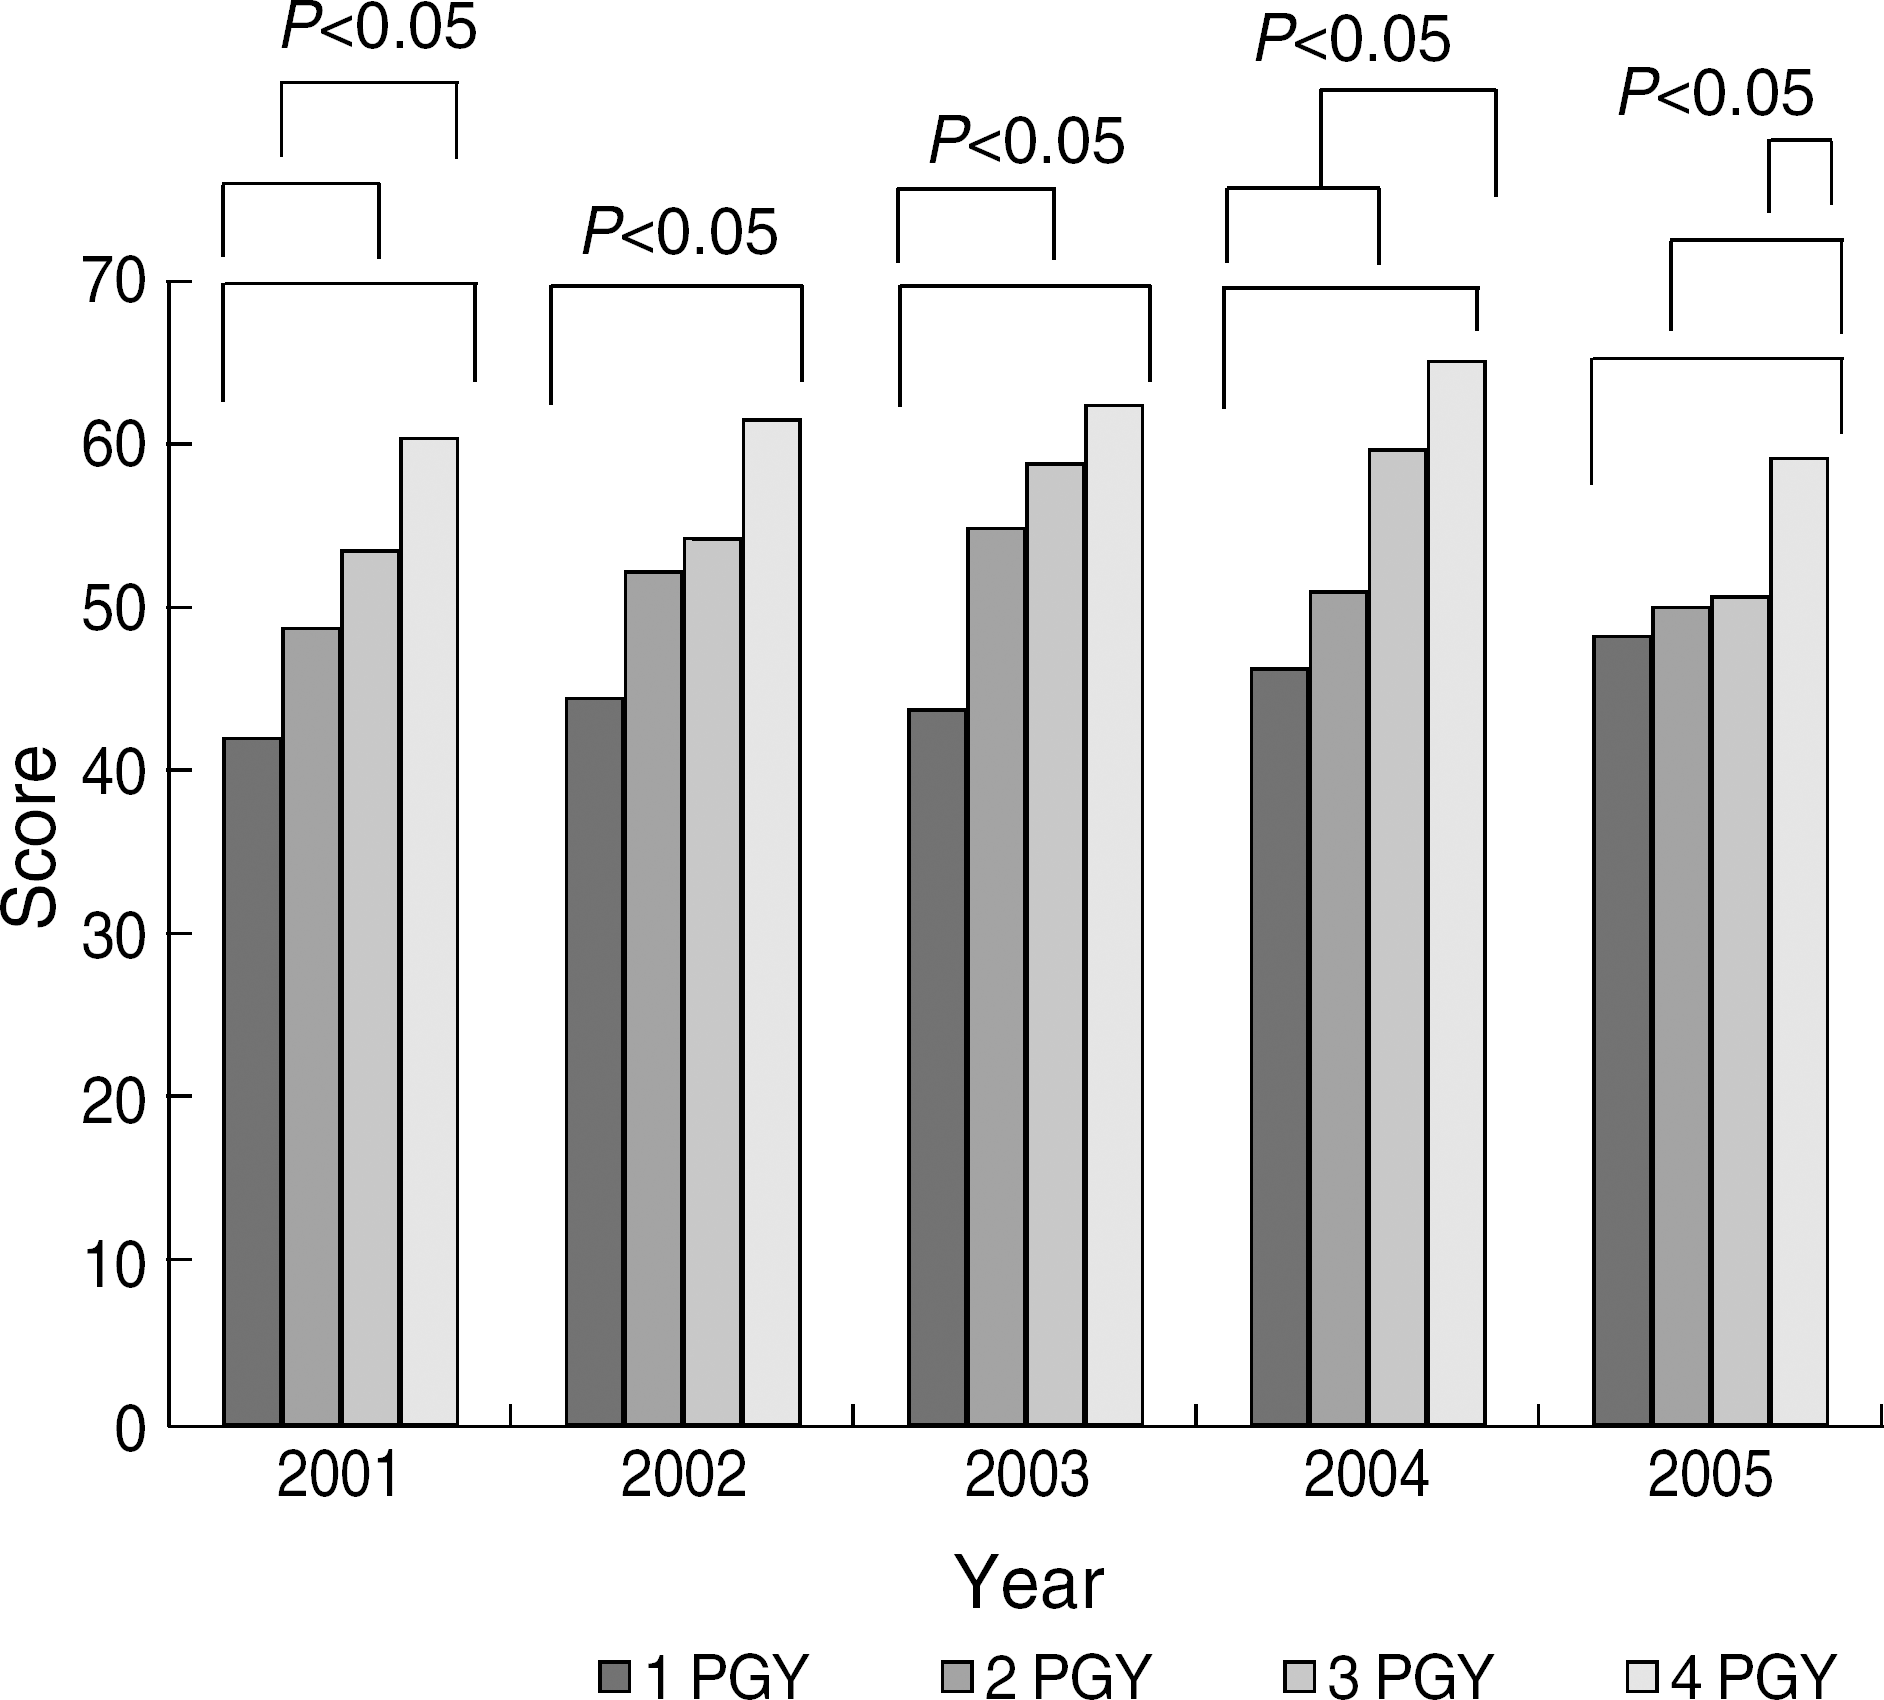
The scores of in-training examinations increased with advance in the examinees' PGY (P<0.01). The scores were not different according to the size of teaching faculty or hospital beds (P>0.05). The correlation coefficients of each PGY scores were from 0.474 to 0.755 (P<0.01). The scores of the 4th PGY were correlated with those of the board examinations (r=0.627, P<0.001).
References
1. Holzman GB, Downing SM, Power ML, Williams SB, Carpentieri A, Schulkin J. Resident performance on the Council on Resident education in Obstetrics and Gynecology (CREOG) in-training examination: years 1996 through 2002. Am J Obstet Gynecol. 2004; 191:359–63.

2. Replogle WH, Johnson WD. Assessing the predictive value of the American Board of Family Practice in-training examination. Fam Med. 2004; 36:185–8.
3. Garibaldi RA, Subhiyah R, Moore ME, Waxman H. The in-training examination in internal medicine: an analysis of resident performance over time. Ann Intern Med. 2002; 137:505–10.

4. Garibaldi RA, Trontell MC, Waxman H, Holbrook JH, Kanya DT, Khoshbin S, et al. The in-training examination in internal medicine. Ann Intern Med. 1994; 121:117–23.

5. Baverstock RJ, MacNeily AE, Cole G. The American Urological Association in-service examination: performance correlates with Canadian and American specialty examinations. J Urol. 2003; 170:527–9.

6. Leigh TM, Johnson TP, Pisacano NJ. Predictive validity of the American Board of Family Practice in-training examination. Acad Med. 1990; 65:454–7.

7. Baumgartner BR, Peterman SB. Relationship between American College of Radiology in-training examination scores and American Board of Radiology written examination scores. Acad Radiol. 1996; 3:873–8.

8. Brill-Edwards P, Evans G, Hamilton P, Hramiak I, Megran D, Schmuck ML, et al. Predicting performance on the Royal College of Physicians and Surgeons of Canada internal medicine written examination. CMAJ. 2001; 165:1305–7.
9. Kearney RA, Sullivan P, Skakun E. Performance on ABA-ASA in-training examination predicts success for RCPSC certification. American Board of Anesthesiology-American Society of Anesthesiologists. Royal College of Physicians and Surgeons of Canada. Can J Anaesth. 2000; 47:914–8.
10. Shetler PL. Observations on the American Board of Surgery in-training examination, board results, and conference attendance. Am J Surg. 1982; 144:292–4.

11. Webb LC, Juul D, Reynolds CF 3rd, Ruiz B, Ruiz P, Scheiber SC, et al. How well does the psychiatry residency in-training examination predict performance on the American Board of Psychiatry and Neurology. Part I. Examination? Am J Psychiatry. 1996; 153:831–2.
12. Song YM, Hwang IH, Byeon JJ. Evaluation of residency program using the result of in-training examination. Korean J Med Educ. 2001; 13:259–67.

13. Jeon SY, Chung MH, Kim KH, Hong WP. Validity of the intraining examinations and the board examinations – An experience in the Korean Society of Otolaryngology. Korean J Med Educ. 1997; 9:151–7.
14. Kim CY, Yoon SJ, Baek HJ, Lee JG, Baek SH, Park SK, et al. Environment and condition of graduate medical education. Korean J Med Educ. 1997; 9:55–63.

15. Kim HO. The assessment of residency program in laboratory medicine. Korean J Lab Med. 2005; 25(Supp 1):S188–98.
Fig. 2.
Correlation between scores of the 4th postgraduate year (PGY) and scores of board examination.

Table 1.
Number of examinees
| Residency level |
Year |
|||||
|---|---|---|---|---|---|---|
| 2001 | 2002 | 2003 | 2004 | 2005 | 2001–2005 | |
| 1 PGY | 13 | 14 | 13 | 23 | 28 | 91 |
| 2 PGY | 15 | 11 | 13 | 10 | 15 | 64 |
| 3 PGY | 17 | 14 | 12 | 15 | 11 | 69 |
| 4 PGY | 30 | 19 | 14 | 11 | 13 | 87 |
| Overall | 75 | 58 | 52 | 59 | 67 | 311 |
Table 2.
Scores of examinees (mean±SD)
Table 3.
Comparison of standard scores (mean±SD) according to the number of teaching faculty
Table 4.
Comparison of standard scores (mean±SD) according to the number of hospital bed


 PDF
PDF ePub
ePub Citation
 Print
Print


 XML Download