

 PDF
PDF ePub
ePub Citation
 Print
Print


INTRODUCTION
Changes in the vaginal microbiome are usually identified by clinical microbiology laboratories through microscopic examinations and vaginal swab cultures. Recently, high-throughput molecular methods, including next-generation sequencing (NGS), have been applied in investigations of the vaginal microbiome, and they have revealed that the vaginal microbiome is more complex than previously thought from the microscopic examination data.
Several studies have used NGS to analyze vaginal microbiomes in various ethnic groups, including African [12], Chinese [34], and four different American ethnic groups [5]. All of these studies analyzed a number of bacterial genes, including 16S rRNA [1345] and cpn60 [2]. However, none of them analyzed microorganisms other than bacteria, such as fungi. Fungi were not even considered in a study of women with vulvovaginal candidiasis [4]. Although some studies have compared NGS results with those of gram-stained swabs [135], no studies have compared NGS results with those of microbiological cultures.
In this study, the vaginal microbiomes of Korean women were analyzed by NGS that included both bacteria and fungi. The potential for using NGS data to predict vaginitis was estimated, and the usefulness of NGS data as a clinical diagnostic tool compared with data from microbiological cultures and DNA probe assays was investigated.
METHODS
1. Specimens and culture
Eighty-nine vaginal swab specimens were collected from 87 patients who visited the gynecological clinics of Seoul National University Hospital, Seoul, Korea, from December 2011 to March 2012. Sixty-seven specimens were also subjected to Gram stain and microbiological cultures. The Nugent scores of 67 specimens were calculated on the basis of the Gram stain results [67]. The specimens were grouped into three categories according to their Nugent scores: normal (score, 0-3), intermediate (score, 4-6), or vaginitis (score, ≥7). After the specimens were inoculated into blood agar plates, MacConkey agar plates, and modified Thayer-Martin agar plates, they were incubated at 37℃ with 5% CO2 for two days. The cultured organisms were identified with VITEK 2 ID Cards (bioMérieux SA, Marcy-l'Etoile, France) and MicroScan Pos ID Panels (Beckman Coulter, Inc., Brea, CA, USA). This study was approved by the Institutional Review Board of Seoul National University Hospital (review number H-1510-073-711).
2. Next-generation sequencing
The PrepMan ultra sample preparation reagent (Thermo Fisher Scientific Inc., Waltham, MA, USA) was used for the nucleic acid extraction according to the manufacturer's instructions. The sequencing of the bacteria, fungi, and Trichomonas vaginalis was performed on the extracted nucleic acids. For the bacteria, the V3-V5 regions of the 16S rRNA gene were the targets. Primers 357F and 926R with an expected amplicon size of 570 bp were used for the bacterial identification [8]. For the fungi, the internal transcribed spacer (ITS) gene was the target. Primers ITS-5 and ITS-4 were used, and they yielded a 700-bp amplicon [9]. For Trichomonas vaginalis, the Tvk gene was the target. Primers TVK3 and TVK7 with an expected 263-bp amplicon were used [10]. The GS Junior System (454 Life Sciences, Branford, CT, USA) was used for the NGS according to the manufacturer's instructions. The minimum sequence length was 150 bp, and the minimum exponential quality score was 20. Only those sequences that fulfilled a minimum of two criteria were included in subsequent analysis.
3. Analysis pipeline
The Usearch for Windows (version 6.0.203) software was used for the sequence processing, clustering, and removing of the chimeric sequences [11]. The similarity threshold for the clustering of two sequences into the same operational taxonomic unit (OTU) was 0.97. For the removal of the chimeric sequences, both de novo and reference modes were used. Two open source chimeric sequence databases for the bacteria and fungi were used in the reference mode [12]. There is no known chimeric sequence database for Trichomonas vaginalis. When a sequence was identified as a chimeric sequence in both de novo and reference modes of Usearch, the sequence was regarded as a true chimeric sequence, and it was removed from the OTU.
The online Ribosomal Database Project (RDP; version 10.3.2) was used for the matching and aligning of the 16S rRNA sequences [13]. Among the RDP sequences, near-full-length (≥ 1,200 bp) sequences of good quality were used for the matching. After comparison with the RDP sequences, each OTU was matched with the one bacterial taxon that showed the highest similarity score. If the similarity score was low (<0.5), the sequence was analyzed again with the nucleotide Basic Local Alignment Search Tool (BLAST) database [14]. The ITS and Tvk sequences were also analyzed in BLAST because these sequences are not included in the RDP [15]. PermutMatrix version 1.9.3 was used to draw a heat map for visualization of the taxonomy [16]. The Shannon diversity index was calculated to estimate the alpha diversity [17]. Two Shannon diversity indices were calculated for each specimen. First, both the 16S rRNA and ITS sequences were included in the calculation. Second, only the 16S rRNA sequences were included in the calculation.
4. DNA probe assay
The BD Affirm VPIII microbial identification test (Becton, Dickinson and Company, Franklin Lakes, NJ, USA) is a direct specimen DNA probe-based diagnostic test for the detection of the Candida spp., Gardnerella vaginalis, and Trichomonas vaginalis. VPIII was performed according to the manufacturer's instructions. In total, 87 specimens were tested with a DNA probe assay. Two specimens could not be tested because of their small volumes.
5. Comparison of the NGS, DNA probe assay, and culture data
We performed a ROC curve analysis of the various predictors of diversity in order to estimate their diagnostic value for vaginitis. Three criteria were used to compare the diagnostic criteria for vaginitis. First, a Nugent score of 4 or more was considered to indicate vaginitis, and this cutoff included both the intermediate and vaginitis groups of the original Nugent criteria [6]. Second, a Nugent score of 7 or more was considered to indicate vaginitis, and this cutoff was similar to that of the original criteria [7]. Third, microbiological culture results other than the normal vaginal flora or Lactobacillus spp. were considered to indicate vaginitis. Because the Nugent criteria are based on bacterial morphotypes and do not consider yeast morphotypes, we compared various other predictors, including the Shannon diversity index of 16S rRNA and the Shannon diversity index of both 16S rRNA and ITS. Other parameters, such as the total number of taxa and the fraction of Lactobacillus spp., were also compared.
6. Statistical analysis
Stata version 13.1 (StataCorp LP, College Station, TX, USA) was used for the statistical analysis. Paired t-tests and one-way ANOVA tests were performed to compare the Shannon diversity indices among the specimens. The Pearson's chi-square values and Cohen's kappa indices were calculated to compare the NGS data, DNA probe assays, and microbiological culture results. A ROC curve analysis was performed to evaluate the various predictors of vaginitis. P values less than 0.05 were considered statistically significant.
RESULTS
1. Read statistics
After removal of the chimeric sequences, 202,958 reads of the 16S rRNA gene and 7,600 reads of the ITS gene were obtained from the 89 specimens (See Supplemental Data Table S1). ITS sequences were detected in 56.2% (50/89) of the specimens. In 38 specimens, fewer than 10 sequences were found. A Tvk gene read was not obtained in any specimen. We tested the NGS of the Tvk gene from cultured Trichomonas vaginalis, and the NGS detected Trichomonas vaginalis correctly. Therefore, we concluded that Trichomonas vaginalis did not exist in any of the specimens. The average sizes of the reads were 364 bp (range, 151-580) for the 16S rRNA gene and 322 bp (range, 180-566) for the ITS gene.
2. OTU statistics and taxonomic allocation
1) 16S rRNA gene
After the clustering, 202,958 reads of the 16S rRNA sequences were clustered into 3,259 OTUs. After the matching of the 16S rRNA sequences with those in the RDP, each OTU was allocated into the single taxon with the highest similarity. Fifty-one sequences with similarity scores less than 0.5 were rematched with the nucleotide BLAST database. Twenty-one sequences did not match any sequence with more than 97% percent identity. We excluded these sequences from further evaluation. The BLAST results for the remaining 30 sequences are shown in Supplemental Data Table S2. Of these, 20 sequences were identified as human DNA by BLAST, and these sequences were excluded from further evaluation. The 10 remaining sequences that were identified by BLAST were included in the subsequent analysis. Finally, 645 OTUs were identified to the species level, and 2,451 OTUs were identified to the genus level.
2) ITS gene
After the clustering, 7,600 reads of the ITS sequences were clustered into 112 OTUs. After taxonomic allocation, 77 OTUs were identified to the species level, and 29 OTUs were identified to the genus level. The Candida spp. had the highest total number of reads, whereas Phialemonium curvatum was detected in the highest number of specimens (See Supplemental Data Tables S3 and S4).
In both the 16S rRNA and ITS taxonomies, the average read length for the taxonomic group with a low similarity score (16S rRNA) or low percent identity (ITS) was similar to that of the taxonomic group with a high similarity scores or high percent identity. Therefore, the similarity scores and percent identities appeared to be independent of read length. Similarly, the read lengths did not differ by taxonomic level.
3. Composition of the vaginal microbiomes
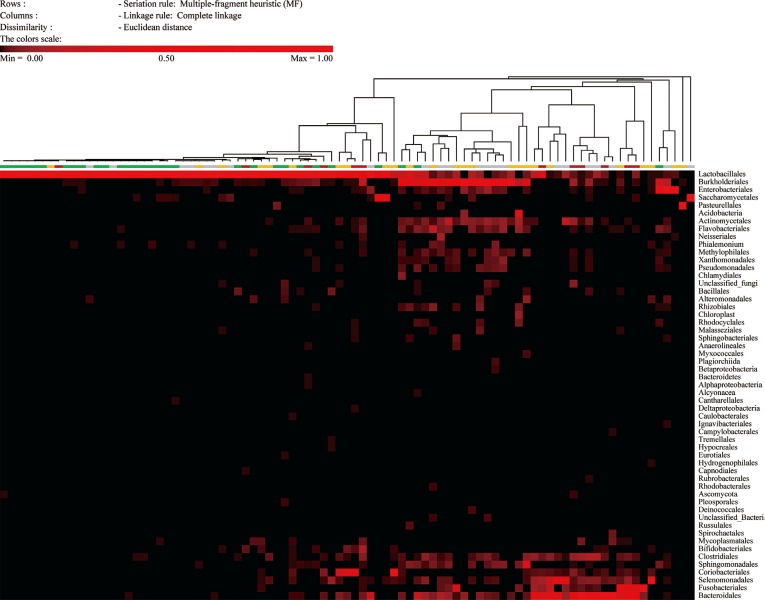
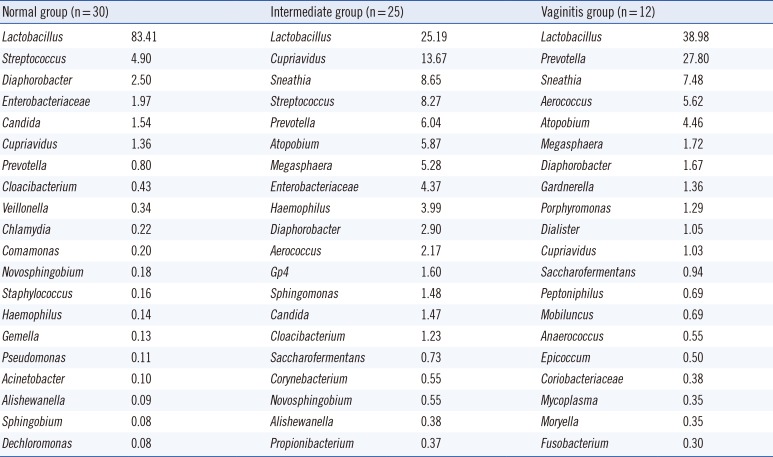
The compositions of the 89 specimens were clustered by Euclidean distance, as shown in the heat map in Fig. 1. The figure contains microorganisms that represent a fraction of the sequences that were greater than 0.1% of the total reads of each specimen. The 67 specimens with Nugent scores were categorized into normal, intermediate, or vaginitis groups. The patterns of the normal groups (green bar in Fig. 1) were distinct from the patterns of the intermediate groups (yellow bar in Fig. 1) and vaginitis groups (red bar in Fig. 1). The most abundant taxa of the three groups are shown in Table 1. In the normal group, the major taxon of the normal group was Lactobacilliales, and other taxa were relatively rare. The patterns of the intermediate group and the vaginitis group were similar. The genera that were more common in the intermediate and vaginitis groups than in the normal group included Prevotella, Sneathia, Aerococcus, Atopobium, Megasphaera, and Cupriavidus.
4. Diversity calculation
The mean Shannon diversity index including both the 16S rRNA and ITS sequences was 1.4137 (95% confidence interval [CI]: 1.2414-1.5859) and that including the 16S rRNA sequence only was 1.3792 (95% CI: 1.2053-1.5530). A paired t-test was used to determine a statistically significant difference (P=0.0005).
5. Association between the diversity parameters and the Nugent scores
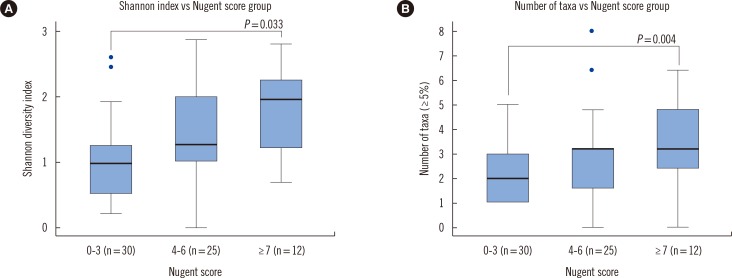
The Shannon diversity index including the 16S rRNA and ITS showed significant associations with the groups based on the Nugent scores (P=0.0037, Fig. 2A). With Bonferroni correction, there was a significant association between the normal Nugent score group and the vaginitis Nugent score group (P=0.033). The number of taxa representing more than 5% of the reads significantly differed among the Nugent score groups (Fig. 2B, P=0.0163). With Bonferroni correction, there was a significant association between the normal Nugent score group and the vaginitis Nugent score group (P=0.004). A one-way ANOVA showed that the proportions of Lactobacillus spp. differed significantly among the Nugent score groups (P<0.0001), and the proportions did not increase in accordance with the Nugent score group. The mean proportions of Lactobacillus spp. in the normal, intermediate, and vaginitis groups were 0.827, 0.262, and 0.426, respectively.
6. Comparison of the NGS, DNA probe assay, and culture data
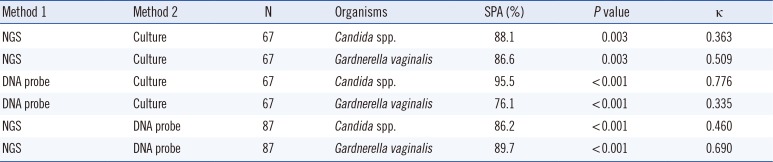
The simple percent agreements of the NGS, DNA probe assay, and culture data ranged from 76.1% to 95.5% for the detection of Candida spp. and Gardnerella vaginalis (Table 2). Pearson's chi-square analysis showed significant associations for all three assays. It was difficult to directly compare the NGS and culture results because the NGS detected many microorganisms and the cultures usually detected only a few. In our study, the NGS and culture results were considered in complete agreement if the NGS results included all of the cultured microorganisms. With this definition of complete agreement, the NGS and culture data showed 73.1% agreement (49/67). Two specimens were considered in partial agreement. In one specimen showing partial agreement, Enterococcus faecalis and Candida albicans were grown, whereas the NGS detected only Candida albicans. In the other specimen, Escherichia coli and Gardnerella vaginalis were grown in culture, whereas the NGS detected only Gardnerella vaginalis. The remaining specimens with discordant results are shown in Supplemental Data Table S5.
7. Comparison of the various predictors of diversity for the diagnosis of vaginitis
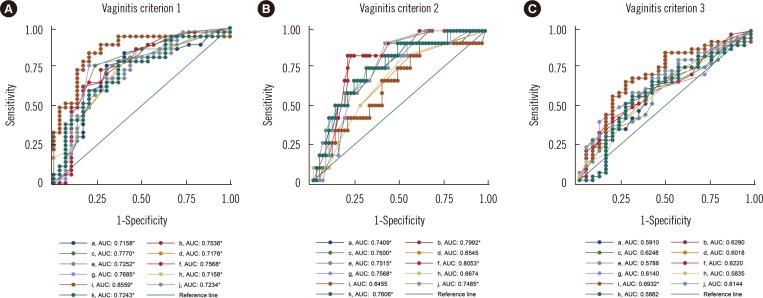
The highest area under the curve (AUC), which was 0.8559, was obtained on the basis of the fraction of lactobacilli and the first criterion for vaginitis (Fig. 3A). When this parameter and criterion combination was applied with a 12.45% lactobacilli fraction cutoff, the sensitivity was 83.78% (95% CI: 68.0-93.8%) and the specificity was 80.00% (95% CI: 61.4-92.3%). All of the predictors showed significant AUC values with the first vaginitis criterion (Nugent score: ≥4).
DISCUSSION
Several studies have analyzed the vaginal microbiome with NGS technology [12345]. Hummelen et al [1] studied the vaginal microbiota of 132 HIV-positive Tanzanian women. Martin et al [18] studied the vaginal swabs of 92 American women (ethnicity unknown). This study showed the highest average read length of 16s rRNA sequences of all of the earlier studies (480 bp). However, the previous studies analyzed only bacteria in the vaginal microbiome and did not analyze fungi. As many bacterial vaginitis cases are accompanied by vulvovaginal candidiasis, an analysis of fungi may provide more information about the vaginal microbiome. In our study, the ITS sequence was found in 56.2% of the specimens, although many specimens included only a few reads of this gene. The Shannon diversity indices also showed significant differences when fungi were included. These results suggest that fungi, as well as bacteria, should be considered in investigations of the vaginal microbiome.
Ravel et al [5] reported a significant difference in the vaginal microbiome composition among four ethnic groups (white, black, Hispanic, and Asian). In that study, the most common group of bacteria that was detected in the asymptomatic women with Asian ethnicity was Lactobacillus iners (42.7%), and the second most common group was L. crispatus (25%). We analyzed the vaginal microbiome of Korean women with NGS, but our data could not be compared directly with the results of Ravel's study because many of the lactobacilli in our study were identified at only the genus level (63.0% in the normal Nugent score group). However, L. iners was more common than L. crispatus among the Lactobacillus identified at the species level in the normal Nugent score group (14.7% vs 11.7%).
The microbiota of the normal Nugent score group were mainly comprised of Lactobacillus, as was expected on the basis of previous reports (Fig. 1). The Shannon diversity index, the number of species, and the proportion of Lactobacillus spp. differed significantly among the Nugent score groups (Figs. 2 and 3). However, the compositions of the intermediate Nugent score group and vaginitis Nugent score group were similar. One cause of this finding could be that the intermediate and vaginitis groups might have been on the same clinical spectrum and thus may have shared similar microbiome patterns. In Fig. 1, the Lactobacillus fraction showed associations with the Nugent score when only the difference between the normal group and the other two groups (combination of the intermediate and vaginitis groups) was considered. However, there was no proportional increase in the fraction according to the Nugent score group (Table 1). Other possible causes included bias by the examiner who graded the Nugent scores and the relatively small number of specimens in the vaginitis group. In our data, all 12 of the specimens comprising the vaginitis group (Nugent score ≥7) had a Nugent score of 8, which suggested the possibility of bias when the Nugent scores were assigned. Because the Nugent scores were greatly dependent on the examiner, bias was possible.
Among the various predictors of diversity, the Lactobacillus fraction showed the highest AUC in the ROC curve analysis (Fig. 3). Because the vaginitis criteria that were used relied on bacterial morphotypes, the predictors that were based on 16S rRNA would be expected to be in good agreement with the vaginitis criteria. If other criteria that consider bacteria and fungi are developed, other predictors may show higher correlations. Because predictors from the NGS data are much less affected by potential examiner subjectivity than the Nugent score is, they are more objective for predicting vaginal microbiome diversity and the associated clinical conditions.
We compared the NGS, DNA probe assay, and microbiological culture data for the detection of vaginal microorganisms. Few studies have compared the use of NGS and culture in investigations of vaginal microbiomes.
Smidt et al [19] compared NGS, quantitative PCR, and culture-based methods in the identification of Lactobacillus spp. To the best of our knowledge, this is the only prior study that compared culture and NGS in an investigation of vaginal specimens. They compared the species agreement within the Lactobacillus genus and reported general concordance of the three methods in the detection of L. crispatus, L. jensenii, and L. gasseri but not of L. iners. In our study, the NGS and microbiological culture showed only 73.1% agreement, whereas the NGS and DNA probe assay showed good agreement.
Salipante et al [20] reported similar results on sputum specimens from cystic fibrosis patients. In their study, 17.3% of the pathogens were identified only by culture, and the total agreement between the NGS and culture results was 56.7%. Some of the reads were lost during the denoising steps of NGS and that this caused some of the failures. They also suggested that the discrepancies reflect various factors, including inefficient DNA extraction from particular organisms, primer bias, and/or properties of the specimens themselves, including internal sample heterogeneity.
In addition, Toma et al [21] reported discrepancies between the culture and NGS results for endotracheal aspirates. Interestingly, they used multiple databases, and the discrepancy percentages differed according to database. The NGS and culture results coincided in 85% of the samples using three databases. They suggested that short microbial reads and amplification bias resulting from mismatches of the universal primers in some specific bacteria might have caused such discrepancies. We did not identify any studies that reported discrepancies between the NGS and culture results in investigations of the vaginal microbiome, but the factors mentioned above could have had similar effects in our study.
The RDP is a very convenient tool for analysis of the 16S rRNA sequences in the NGS data. It provides a taxonomic ranking of sequences in a form that can easily be converted to various data platforms. However, our results showed some possible significant mismatches with low similarity scores. Fettweis et al [22] noted similar mismatches. In our study, several RDP results with low similarity scores were identified as human DNA and Candida spp. Because vaginal swabs can include nucleic acid from humans and microorganisms other than bacteria, sequences with poor similarity scores should be analyzed with other databases.
This study had some limitations. First, we could not evaluate the various analytical performance parameters, but we investigated the possibility of the use of NGS as a clinical diagnostic tool. We evaluated the accuracy of the NGS assay by comparison with the culture and DNA probe assay results. Second, the NGS results and microbiological culture results were indirectly compared.
Other problems remain with the use of NGS as a clinical diagnostic tool [20]. Although the cost of NGS is decreasing rapidly, it is still too high for use as a clinical test. The interpretation of the NGS data is complicated, and few recognizable standards for NGS interpretation exist.
In our study, NGS data elucidated the frequent existence of fungi in vaginal specimens and the similarity of composition between the intermediate and vaginitis Nugent score groups. Although some problems remain to be resolved, NGS could become a powerful method for investigating vaginal microbiomes in clinical diseases that are associated with specific vaginal microbiome profiles.
 XML Download