

 PDF
PDF ePub
ePub Citation
 Print
Print


INTRODUCTION
Mitochondria are membrane-enclosed intracellular organelles present in most eukaryotic cells, and they have their own independent genome [12]. Mitochondria generate most of the cellular requirement of adenosine triphosphate (ATP; a major energy source), and are involved in cell signaling, cellular differentiation, apoptosis, cell cycle regulation, and cell growth [3]. Human mitochondrial DNA (mtDNA) contains 16,569 bp and represents 0.1-1.0% of total genomic DNA [4]. It also harbors the coding sequences for the seven subunits of NADH-ubiquinone reductase (respiratory complex I), three subunits of the cytochrome c oxidase complex (respiratory complex IV), two subunits of ATP synthase, and the coding sequences of two mitochondrial rRNAs, 22 mitochondrial specific tRNAs, and protein apocytochrome b (a component of ubiquinone cytochrome c reductase complex or 'respiratory complex III'). All of these genes are continually expressed without the intervention of noncoding sequences, except for a small segment called the displacement-loop (D-loop), which contains some of the replication and transcription origins of mitochondria genomes [5]. mtDNA is 10- to 20- fold more susceptible to genetic mutation than nuclear DNA. Moreover, the mtDNA repair system is relatively inefficient, since mtDNA is localized near the inner mitochondrial membrane, where it is exposed to reactive oxygen species (ROS) produced during ATP synthesis [467].
It has been recently suggested that mtDNA mutations are responsible for tumorigenesis (the mitochondrial theory of cancer) [89]. Recent studies have also demonstrated that mtDNA mutations increase the metastatic potential of tumor cells, owing to increased ROS overproduction [10].
Variations in mtDNA copy numbers can also result in disease. It has been hypothesized that mtDNA mutations or decreases in mtDNA copy number reduce oxidative phosphorylation and enhance the generation of ATP by glycolysis [11]. Altered mtDNA copy numbers have been observed in human hepatocellular carcinoma [12], and mtDNA depletion has been associated with infantile neurogenetic disorders [13]. Furthermore, decreases in mtDNA copy number have been associated with breast cancer [14] and renal cell carcinoma [15], and with the pathogenesis of osteosarcoma in Chinese patients [16]. In contrast, mtDNA copy numbers are significantly elevated in colorectal cancer tissues [3], and are associated with an increased risk of non-Hodgkin lymphoma [17].
Pediatric AML is a rare and heterogeneous disease, with an incidence of seven cases per million in children younger than 15 yr [18]. Although AML has long been recognized for its morphological and cytogenetic heterogeneity, recent high-resolution genomic profiling has demonstrated a complexity much greater than previously imagined. This complexity can be seen in the number and diversity of genetic alterations, epigenetic modifications, and characteristics of leukemic stem cells. The broad range of abnormalities observed across various AML subtypes suggests that improvements in clinical outcomes require the development of specific therapies targeting each subtype of the disease and the design of novel clinical trials to test these strategies. Accordingly, it is unlikely that any further gains in long-term survival rates will be possible by mere intensification of conventional chemotherapy [19].
Previous studies have highlighted the different frequencies of specific mitochondrial polymorphisms between pediatric ALL patients and normal controls. Specific polymorphisms have also been associated with prognostically important subgroups of leukemia [20]. However, relationships between pediatric AML and mitochondrial aberrations remain elusive. This study was performed to analyze mtDNA aberrations in pediatric AML patients and to evaluate the clinical implications of these alterations.
METHODS
1. Patients and controls
We enrolled 55 pediatric AML patients and 55 matched (age and gender) healthy controls from the Environmental Health Center for Childhood Leukemia and Cancer Cohort of Korea between February 2004 and February 2012. Patients were enrolled when they were diagnosed. In the cohort of pediatric AML patients, risk group classification was as follows (number/%): low risk, 23 (41.8%); intermediate risk, 26 (47.2%); and high risk, six (11.0%) (Detailed information is provided in the Supplemental Data Table S1 and S2). This study was approved by the institutional review board of Chonnam National University Hwasun Hospital (Hwasun, Korea). Peripheral blood (PB) and bone marrow (BM) samples were collected after receiving written informed consent from the patients and controls.
2. DNA extraction from pediatric AML patients and controls
Mononuclear cells were isolated from the PB and BM samples of pediatric AML patientsand controls. Total DNA was extracted by using a commercial kit (QIAamp DNA blood mini kits; QIAGEN, Hilden, Germany).
3. AML cell sorting
To compare mtDNA sequence alterations between AML cells and non-AML cells in the same patients, five patients were selected. The BM mononuclear cells were isolated by performing density gradient centrifugation for 10 min at 262 g. Cell pellets were then washed twice with phosphate-buffered saline (PBS), and the density of cells suspended in PBS was adjusted to 5×10⁶ cells/mL. Subsequently, 5 µL of anti-CD34 fluorescein isothiocyanate (FITC)-conjugated antibody and 5 µL of anti-CD45 phycoerythrin-cyanine 5.1 (PC5)-conjugated antibody (Beckman Coulter, Marseille, France) were added to 12-×75-mm tubes containing 100 µL of the cell suspension. After incubation for 20 min at 4℃, cells were washed with cold PBS and resuspended in 0.5 mL of PBS buffer. Cell sorting was performed on a flow cytometer (FACSAria, BD Biosciences, San Jose, CA, USA). CD34+ CD45dim AML cells and CD34dim CD45+ non-AML cells were collected in 12-×75- mm tubes containing 100 µL of PBS.
4. Direct sequencing of the mtDNA control, the tRNA leucine 1, and the cytochrome b regions
PCR was performed to directly sequence the control region (nucleotides 16,024-16,569 and 1-576), tRNA leucine 1 (nucleotides 2,972-3,557), and cytochrome b (CYTB) (nucleotides 14,909-15,396) of mtDNA, by using the designated primer pair set (See Supplemental Data Table S3). PCR mixtures consisted of 50-100 ng of total DNA, 20 pmol of forward and 20 pmol of reverse primer, 0.4 mM of the deoxynucleoside triphosphates (dNTPs), 5 µL of the 10× F-taq reaction buffer, 5 U of DNA polymerase (Solgent, Daejeon, Korea), and H2O (final reaction volume of 50 µL). PCR was carried out in a TAKARA PCR thermal cycler (TAKARA, Shiga, Japan). PCR products were purified by using the Expin PCR SV kit (GeneAll, Seoul, Korea). Sequencing was performed by using the ABI Prism 3130XL Genetic Analyzer and the BigDye Terminator v3.1 Ready Reaction Kit (Applied Biosystems, Foster City, CA, USA).
The obtained mtDNA sequences were analyzed by using MitoAnalyzer (http://www.cstl.nist.gov/biotech/strbase/mitoanalyzer.html) and the Revised Cambridge Reference sequence (http://www.mitomap.org/) in order to determine the presence of mtDNA polymorphisms and mutations.
6. Determination of mtDNA minisatellite instability
To determine the qualitative and quantitative profiles of the poly-C mtDNA length heteroplasmies in the hypervariable (HV)2 and HV1 regions, three mtDNA minisatellite markers, viz. 16,189 poly C, 303 poly C, and the 514 (CA) repeats were used. Each forward primer was labeled with HEX fluorescent dye (See Supplemental Data Table S3). First, the poly-C tracts of mtDNA were amplified in a 50-µL reaction mixture containing 50 ng of total DNA, 20 pmol of each component of primer pair, 0.4 mM of each dNTP, 5 U of DNA polymerase (Solgent), 5 µL of 10× buffer, and distilled water (DW). After the completion of PCR, 1 µL of each PCR product and 0.5 µL of the gene scan internal size standard, labeled with the fluorescent dye ROX (Applied Biosystems), were added to 20 µL of deionized formamide. Denatured PCR products were separated by capillary electrophoresis (CE) by using the ABI Prism 3130 Genetic Analyzer and Gene Scan Analysis Software (version 3.1) (Applied Biosystems).
7. Determination of mtDNA copy number
To generate a standard curve for the quantification of mtDNA, purified PCR products of the CYTB and β-actin genes were inserted into pGEM-T Easy vector. Escherichia coli JM 109 cells (Promega; Madison, WI, USA) were transformed with these constructs to obtain the recombinant plasmids. Reaction volumes of 25 µL comprised 12.5 µL of 2× Quantitect SYBR green PCR master mix (Qiagen, Valencia, CA, USA), 10 pmol of forward and of reverse primer (See Supplemental Data Table S3), RNase-free water, and 50 ng of the total DNA (or the standard).mtDNA copy numbers are expressed as ratios of the target gene (CYTB) versus the standard (β-actin) [3].
8. Measurement of ROS
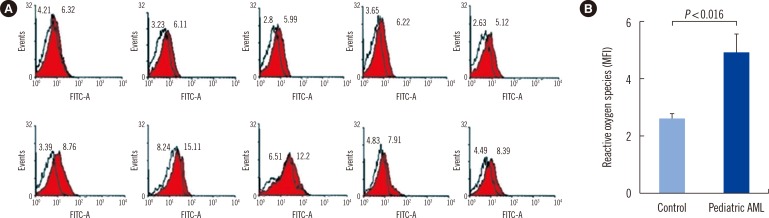
DCFH-DA and flow cytometry were used to detect changes in intracellular ROS levels. Briefly, 2', 7'-dichlorofluorescein-diacetate (DCFH-DA) (Sigma, St. Louis, MO, USA) was dissolved in 95% ethanol to a concentration of 5 mmol/L, stored in dark at 4℃, and diluted to 5 µmol/L with PBS just before use. Cell suspensions (1×10⁶ cells/mL) were placed in test tubes containing 10 µL of 2', 7'-DCFH-DA and were incubated in a 37℃ water bath for 20 min in the dark. After centrifugation for 5 min at 410 g and resuspension in 600 µL of PBS, intensities of dichlorofluorescein (DCF) green fluorescence were measured by using a FACSAria cell sorter (BD, San Jose, CA, USA).
9. Mitochondrial mass and membrane potential
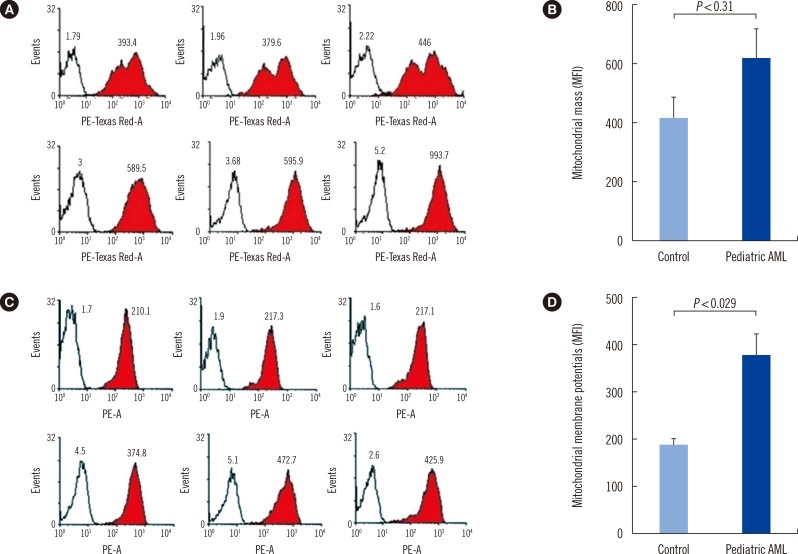
To label mitochondria, we used cell-permeant MitoTracker probes (Invitrogen, Carlsbad, CA, USA), which contain a mild thiol-reactive chloromethyl moiety. MitoTracker green/red stock solutions were prepared in dimethyl sulfoxide (DMSO), and 1×10⁶ of cells were suspended in 500 µL of the RPMI 1640 medium (GIBCOInvitrogen, Carlsbad, CA, USA) containing 10% fetal bovine serum (FBS) and supplemented with 2 µL of the MitoTracker green/red working solution (200 µmol). These mixtures were then incubated in the dark at 37℃ for 20 min, and subsequently placed on ice for immediate flow cytometric detection (FACSAria).
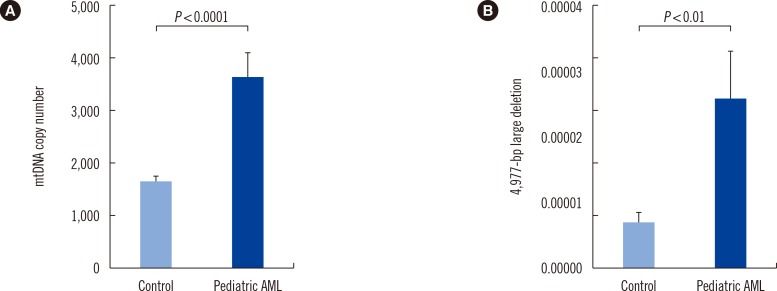
10. Quantitative assessment of the mtDNA 4,977-bp large deletion
Real-time PCR and gene scans were performed to quantitatively assess the mtDNA 4,977-bp large deletionin AML cells (and in the PB cells of matched healthy controls), which was measured as previously described [3].
11. Statistical analysis
The spectra of mtDNA mutational aberrations were assessed with respect to patient gender and age by using the chi-square test and the Student's t-test. Logistic regression analysis was used to dissect the individual impact of mtDNA copy number and 4,977-bp large deletion for risk (odds ratio) of developing pediatric AML. Overall survival (OS) and event-free survival (EFS) were estimated by using Kaplan-Meier analysis. OS was defined as the time between diagnosis and death from any cause. EFS was defined as time between diagnosis and relapse or disease progression. Detailed specific mean value of each variable were described in supplemental data tables. Statistical significance was accepted for P values less than 0.05. The statistical analysis was carried out by using SPSS for Windows version 18.0 (SPSS Inc., Chicago, IL, USA).
RESULTS
1. mtDNA sequence modifications in pediatric AML patients and controls
To analyze qualitative changes in the mtDNA sequence in the 55 pediatric AML patients and 55 controls, the 1,124 bp (nucleotide positions [np] 16,024-16,576) mtDNA control region known as 'multiple mutational hotspots' [24] (containing the origins of replication and promoters for transcription [25]) was targeted, and the corresponding CYTB and tRNA leucine 1 regions were subjected to direct sequencing (See Supplemental Data Figure S1).
The 189 mtDNA sequence variants found in pediatric AML patients and controls are shown in Supplemental Data Table S4. In controls, the mtDNA sequence alterations, which consisted of 49 polymorphisms, have already been listed in a published polymorphism database (http://infinity.gen.emory.edu/mitomap.html). However, two novel sequence alterations (including unpublished mtDNA polymorphisms) were detected. In patients, 56 mtDNA nucleotide changes were detected, and four new mtDNA variants were detected in BM cells.
2. Novel mtDNA alterations in AML cells and non-AML cells
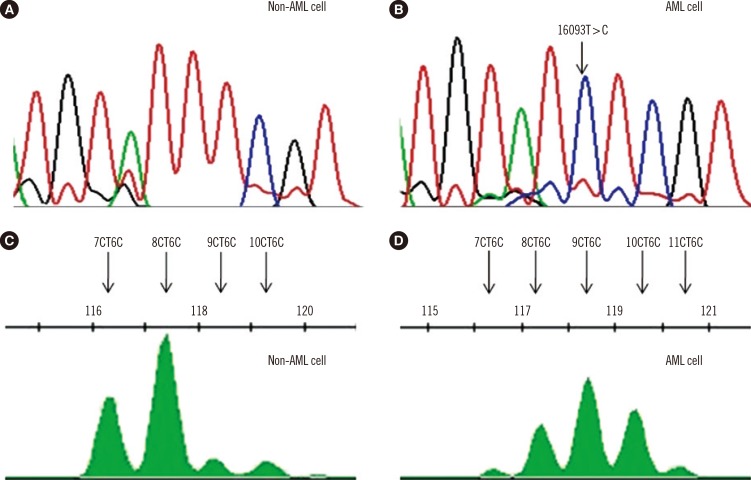
To compare mtDNA sequence alterations between AML cells and non-AML cells in the same patients, direct sequencing of the mtDNA control region and of the CYTB and tRNA leucine 1 genes was performed. Among the five selected patients, one patient showed mtDNA sequence changes in AML and non-AML cells (Fig. 1).
3. Length heteroplasmy in mtDNA microsatellites
Length heteroplasmy was observed in the np 303-315 poly C (HV2) and np 16,184-16,193 poly C (HV1) regions by sequencing analysis. However, we were unable to sequence beyond the length heteroplasmy because of varying frame shifts in one individual [26]. It is important to distinguish between sequence heteroplasmy (i.e., single nucleotide changes and small indels) and length heteroplasmy (i.e., varying numbers of a particular repeated nucleotide; usually poly C). Low levels of a minor sequence heteroplasmy (in which the minor species comprises less than 20%) are technically difficult to detect [6], because poly C regions usually interfere with sequencing.
Hence, the differently sized, fluorescently labeled PCR products were separated by gene scan analysis to identify each mtDNA length variant within heteroplasmic mixtures. Gene scan analysis showed 303 poly C, 514 CA repeats, and 16,184 poly C length heteroplasmies in pediatric AML patients and controls, and 303 poly C and 16,184 poly C microsatellites were found to be unstable.
The length heteroplasmy patterns in the 303 poly C tract were classified into 15 types for pediatric AML patients, whereas 11 types in 303 poly C tract length heteroplasmies were observed in controls. For 16,184 poly C, 16 patterns were detected in patients and 12 in controls. Moreover, heteroplasmies in the 303 poly C and 16,184 poly C tracts were more predominant in patients than in controls (See Supplemental Data Table S5).
4. Distribution of mtDNA haplogroups in pediatric AML patients
The human mtDNA haplogroup is a population category that is defined by differences in human mtDNA. The general patterns and frequencies of haplogroups in patients were similar to those in controls. However, more mtDNA haplogroup subtypes were found in patients than in controls. In addition, mtDNA haplogroup D4 showed a decreased risk of pediatric AML development (odds ratio [OR]: 0.21, 95% CI; 0.06-0.74, See Supplemental Data Table S6).
5. Elevated mtDNA copy number in pediatric AML cells
mtDNA copy numbers were determined by relative quantitative PCR with the CYTB gene serving as an internal mitochondrial gene and the β-actin gene serving as an external nuclear gene (or standard). The mean mtDNA copy numbers (ratio of CYTB to β-actin) of pediatric AML cells and control cells were 3,971 and 1,767, respectively. mtDNA copy number was significantly higher for pediatric AML patients than controls (P<0.0001, Fig. 2A).
6. Elevated intracellular ROS levels in pediatric AML BM cells
ROS (H2O2) levels in patient BM cells and in control PB cells were measured to determine whether intracellular ROS level affects mtDNA alterations in pediatric AML patients and controls. Intracellular ROS levels were found to be significantly higher in patients (4.96±1.96 mean fluorescence intensity [MFI]) than in controls (2.65±0.41 MFI) (P=0.016, Fig. 3).
7. Increase in the mitochondrial mass and membrane potential
There was no significant difference of mitochondrial mass between patients and controls (Fig. 4A, B), and patients were found to have higher mitochondrial membrane potentials than controls (P=0.029, Fig. 4C, D).
9. Association between mtDNA copy number and pediatric AML
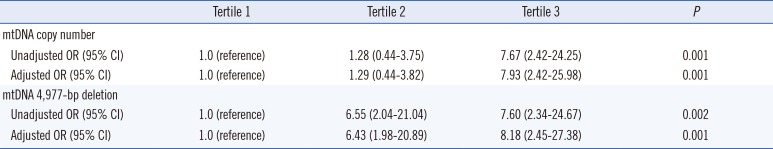
Multivariate unconditional logistic regression analysis (adjusted for age and sex) was performed to assess the association between mtDNA copy number and the risk of developing pediatric AML. As shown in Table 1, a close relationship was found between tertiles of mtDNA copy number and the risk of developing pediatric AML. When the first tertile was used as the reference group, the adjusted ORs (aORs) of the second and third tertiles were 1.29 (95% CI: 0.44-3.82) and 7.93 (95% CI: 2.42-25.98), respectively (P=0.001). Similarly, this trend was also observed between tertiles of the mtDNA 4,977-bp large deletion and the risk of pediatric AML (P=0.001).
10. Effect of the mtDNA 4,977-bp large deletion on the prognosis of pediatric AML
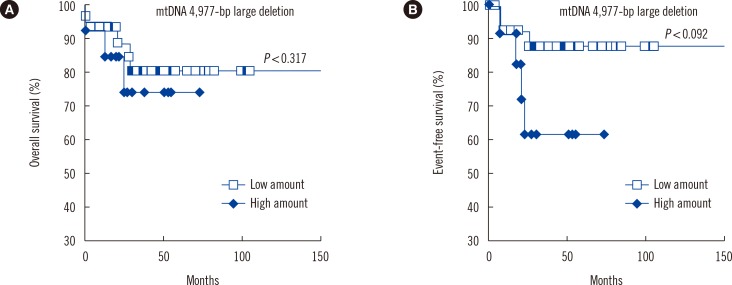
Pediatric AML patients harboring high amount of mtDNA 4,977-bp large deletion showed shorter OS (P=0.317) and EFS (P=0.092), than those with low amount of mtDNA 4,977-bp large deletion (Fig. 5).
DISCUSSION
Although several studies on mitochondrial mutations in adult leukemia have been reported [2728], no such study has been performed on pediatric AML, and thus, we investigated mitochondrial aberrations in pediatric AML patients and evaluated their clinical implications.
The mitochondrial D-loop is a major control site for mtDNA replication and transcription, and is more sensitive to damage than the other regions of mtDNA. It has been proposed that a high frequency of somatic mutations in the D-loop may be responsible for the increase in the mtDNA copy number [29]. Our findings concur with the aforementioned reports. New mtDNA variants and many polymorphisms in the control region and in the CYTB and tRNA leucine 1 genes were detected in pediatric AML patients and controls. The clinical behavior of controls with a newly detected mtDNA mutation in the tRNA leucine 1 gene needs to be carefully monitored, as tRNA leucine 1 is very important for protein translation.
The analysis of nucleotide changes located in mtDNA minisatellites showed that poly C tracts at np 303-315 and np 16,184-16,189 (in the D-loop region of mtDNA) had greater heteroplasmy lengths in patients than in controls. Mitochondrial genome instability has been strongly correlated with a high incidence of circular mtDNA molecules (of multiple lengths) in human leukemic cells, and a positive correlation between the frequency of these molecules and the disease severity has been reported [3031].
Researchers have associated mtDNA haplogroups with various cancers, metabolic diseases, neurodegenerative diseases, and aging. A previous study showed that patients with mtDNA haplogroup M have an increased risk of breast cancer [32]. As mentioned earlier, mtDNA haplogroup D4 might be associated with a reduced risk of pediatric AML (See Supplemental Data Table S6). The number of patients enrolled in the present study was too small, and thus we suggest an extended investigation be conducted on a larger cohort to identify the relationships between mtDNA haplogroups and the risk of pediatric AML.
In an attempt to identify severe aberrations in the mtDNA sequence, we performed mtDNA copy number determination and 4,977-bp large deletion analysis. This study showed that the mtDNA copy number was significantly increased in pediatric AML cells than in the control cells. This finding may be explained by an excessive need for ATP and by the mitochondrial dysfunction resulting from mtDNA alterations in AML cells. The mechanisms by which altered mtDNA copy number plays a role in the pathogeneses of diseases remain elusive. However, several reasonable mechanisms have been postulated. Alterations in the mitochondrial genome can alter mitochondrial gene expression and lead to defective oxidative phosphorylation and to an enhancement in the production of ATP. Oxidative stress could potentially damage mtDNA or disturb mitochondrial components, including mitochondrial membranes. Thus, compensatory machinery activated during cellular stress may lead to an increase in mtDNA copy number [2933]. Our results are in accordance with these proposals. Intracellular ROS levels were significantly elevated in BM cells of pediatric AML patients membrane potentials were elevated. However, although mitochondrial mass was slightly increased, this increase was not significant. These findings support the aforementioned hypothesis, and suggest that increased mtDNA copy number is not due to increased mitochondrial mass. Nevertheless, the mtDNA turnover rate and the proteins involved in the replication and degradation of mtDNA are important areas for future research [34].
In the present study, a higher rate of mitochondrial aberrations was detected in pediatric AML patients than in controls. Furthermore, mtDNA copy number was found to be associated with an increased risk of pediatric AML. mtDNA 4,977-bp large deletion mutations have been implicated in aging and carcinogenesis. Meanwhile, a previous study on ALL patients found no difference in the amount of mtDNA in patients and healthy controls at the time of diagnosis [20]. However, the amount of mtDNA was found to be dependent on tumor type. In addition, mtDNA depletion has been reported in many studies on solid tumors, whereas increased mitochondrial mass was found in chronic lymphoid leukemia [12353637].
This study shows that the extent of mtDNA 4,977-bp large deletion is significantly higher in pediatric AML cells than in control cells. These findings may be explained by events that occur during ATP synthesis. The overproduction of ROS not only affects mtDNA copy number but also the 4,977-bp large deletion. The present study also demonstrated that patients with more mtDNA aberrations are at greater risk of developing pediatric AML. Previous studies have correlated elevated mitochondrial copy number with resistance to chemotherapeutic drugs [38] and poor response to therapy [39] in adult hematological malignancies. In the present study, patients harboring a high amount of mtDNA 4,977-bp deletion had shorter OS (P=0.317) and EFS (P=0.092) than those with low amount of mtDNA 4,977-bp deletion.
In conclusion, mitochondrial aberrations were markedly more common in pediatric AML patients than in controls. Furthermore, specific polymorphisms were found to be associated with the risk of leukemia. It appears that polymorphisms at and around the transcriptional control region potentially contribute to tumorigenesis
 XML Download