

 PDF
PDF ePub
ePub Citation
 Print
Print


INTRODUCTION
Donor specific antibodies (DSA) against HLA are associated with poor graft outcomes after organ transplantation [1, 2, 3]. Single antigen bead assays (SAB) have been widely used to identify DSA, and assessment of the median fluorescence intensity (MFI) values provided by SAB has been utilized by many clinicians to make decisions on treatment plans or desensitization therapy, both before and after transplantation [4, 5]. Furthermore, the UNet system created by the United Network for Organ Sharing (UNOS) utilizes semi-quantitative MFI values to identify unacceptable antigens and to choose donors for paired kidney donations [6]. Nevertheless, it has yet to be established whether high titers of DSA are detrimental to graft outcome [7, 8, 9]. Likewise, it is unclear whether the MFI values obtained by SAB are concordant between laboratories. Indeed, the quantitative MFI values from SAB analyses can vary owing to lack of automation, differences in protocols between laboratories, different methods of data analysis, and variations in the bead composition between manufacturers [10, 11, 12]. Therefore, standardization of SAB assays and evaluation of consistency between laboratories are essential for proper interpretation of SAB results and for the comparison of data across laboratories.
In a recent study, similar MFI results were obtained from four laboratories by using reagents from the same lot, identical protocols, and LAB Screen Single Antigen Beads (One Lambda, Canoga Park, CA, USA) [13]. In Korea, however, the most commonly used kits for SAB analysis are the Lifecodes LSA Class I and Class II Single Antigen kits (Immucor, Stamford, CT, USA). We therefore investigated interlaboratory variability in MFI results obtained by SAB that were due to differences in laboratory conditions. For this analysis, each laboratory used identical protocols and Lifecodes LSA Class I and Class II kits from the same lots.
METHODS
1. Sera
Six serum samples were selected from an inventory (stored at -80℃) of leftover sera from Seoul National University Hospital. Selected sera had HLA-specific antibodies detected by SAB and covered all HLA class I and/or class II antibodies against HLA antigens with incidence of more than 1% in Koreans. All sera were thawed, aliquoted, and stored at -20℃ for three days until shipment. The serum aliquots were shipped on dry ice to four other laboratories (YH, BH, CH, and SH). All participating laboratories were tertiary teaching hospitals with a bed capacity of over 1,200. All SABs were performed within 24 hr of sample receipt. This study was approved by the Institutional Review Board of Seoul National University Hospital (IRB No. 1306-023-496).
2. Single antigen bead assay (SAB)
In the five participating laboratories, sera were tested for the presence of anti-HLA antibodies by using identical lots of Lifecodes LSA Class I and Class II kits (LSA Class I 03203F beads and LSA Class II 01133Y beads; Immucor), according to the manufacturer's instructions in the product manual. Briefly, 10 µL of each serum sample and 40 µL of HLA Class I and Class II Single Antigen Luminex beads were mixed in Millipore MultiScreen filter plates (Millipore, Darmstadt, Germany) and incubated in the dark for 30 min at room temperature. After washing with the wash buffer, 50 µL of phycoerythrin-conjugated goat anti-human IgG was added to the beads and incubated for 30 min in the dark at room temperature. After a second wash step, the fluorescence intensities of the samples were measured by using a Luminex 200 system (Luminex Corp., Austin, TX, USA).
Data analysis was performed by using Match IT version 1.0.0.8 software provided by the manufacturer (Immucor). The positive control beads were coated with human IgG and were designed to yield MFI values >2,000 when incubated with the positive or negative control sera. Conversely, the negative control beads (CON1, CON2, and CON3) typically yield low MFI values (lot specific) when treated with the positive or negative control sera. To identify positive bead reactions, the background MFI value was subtracted from the raw MFI value to generate the adjusted value 1 (background corrected MFI) for each individual bead. Adjusted value 1 was then divided by the MFI value from the calculated control (CalcCON) of its respective locus to generate adjusted value 2. The CalcCON for each locus was considered the raw MFI value of the lowest ranked antigen bead for that locus. Adjusted value 3 was generated by normalization of adjusted value 2 to the amount of antigen on each bead, as indicated in the lot-specific recording sheet. Positive results were assigned when two out of three criteria (adjusted value 1 >1,000, adjusted value 2 >5.0, or adjusted value 3 >5.0) were fulfilled. SAB kits were composed of 93 Class I and 80 Class II specific beads and incorporated one positive control and three negative control beads for each set.
3. Statistical analyses
Data were collected from the five participating laboratories in the form of comma-separated values (CSV) files, and the MFI values were analyzed. To assess the concordance of categorical results (positive or negative), background corrected MFI values were classified as either positive or negative by using different cutoff values: 1,000, 3,000, 5,000, and 10,000. The percentages of beads yielding concordant categorical results among the five laboratories at each cutoff value were then calculated. For categorical results that were discordant among the laboratories, the median MFI values from each of the five research groups (SN, YH, BH, CH, and SH) were analyzed according to the different cutoff values (1,000, 3,000, 5,000, and 10,000).
For quantitative results, the MFI values from one bead within one serum were compared across five laboratories in a pair-wise fashion with Pearson's correlations. The correlation coefficients were analyzed according to four different MFI ranges (<1,000; 1,000-2,999; 3,000-7,999; ≥8,000 for class I, <1,000; 1,000-4,999; 5,000-9,999; ≥10,000 for class II) and the six different sera tested. Correlation results were categorized according to absolute value of correlation coefficient (r): very weak for 0.00-0.19, weak for 0.20-0.39, moderate for 0.40-0.59, strong for 0.60-0.79, and very strong for 0.80-0.10 with the significance level of P=0.05. The CV for the MFI values among the five laboratories were analyzed according to five MFI ranges, grouped by the mean MFI values from the five laboratories (<1,000; 1,000-2,999; 3,000-4,999; 5,000-9,999; and ≥10,000) and the distinct HLA antigens (HLA-A, B, C, DR, DQ, and DP). Non-categorical variables between two groups were compared by Mann-Whitney test. The variance components were estimated to assess random effects for between-bead, between-sample, and between-laboratory variability, including the residual variability, using the general linear model. All analyses were conducted by using SPSS software for Windows, version 21.0 (SPSS Inc., Chicago, IL, USA).
RESULTS
1. Interlaboratory concordance of categorical results
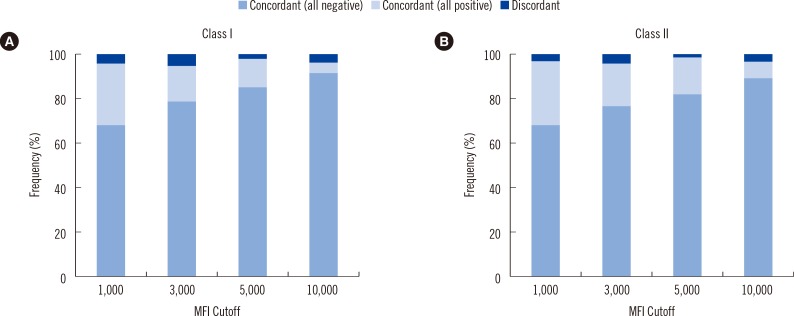
The concordance of results was assessed for each bead. Results for a particular bead were considered concordant only if the participating five laboratories obtained the same outcome (either positive or negative). For class I antigens, 94.8-97.3% of the beads yielded concordant results in the six sera among the laboratories at four different MFI cutoffs: 1,000, 3,000, 5,000, and 10,000 (Fig. 1A). When an MFI of 1,000 was used as the cutoff, 95.5% of the 558 beads (93 beads×6 sera) yielded concordant results; 68.6% of the beads were consistently negative, and 26.9% of beads were consistently positive. At MFI cutoffs of 3,000, 5,000, and 10,000, 94.8% (529/558 beads, 79.2% negative and 15.6% positive), 97.3% (543/558 beads, 85.7% negative and 11.6% positive) and 96.4% (538/558 beads, 93.4% negative and 3.0% positive) of the beads exhibited concordant results, respectively. Overall, 96.0% (2,143/2,232 beads) of the beads yielded consistent results in the participating laboratories for detection of HLA class I antibodies.
The Class II beads exhibited 96.3-99.0% concordance across the five laboratories at the four different cutoffs (Fig. 1B). When an MFI of 1,000 was used as the cutoff, 96.9% of the 480 beads (80 beads×6 sera) yielded concordant results, 28.1% (135/480 beads) of which were positive. When the MFI cutoff was set at 3,000, 5,000, and 10,000, 96.3% (462/480, 76.9% negative and 19.4% positive), 99.0% (475/480 beads, 81.9% negative and 17.1% positive) and 96.9% (465/480 beads, 89.6% negative and 7.3% positive) of the beads yielded consistent results across laboratories, respectively. Overall, 97.2% (1,867/1,920 beads, 79.3% positive and 18.0% negative) of the beads provided consistent outcomes in the participating laboratories. Furthermore, these concordance rates were not affected by different cutoffs, samples, or HLA classes (P>0.05).
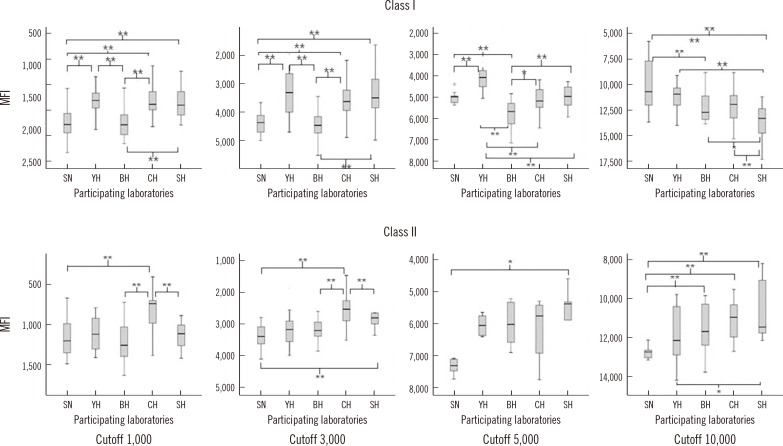
The median MFI values for the results that were discordant among the five laboratories at each cutoff value are depicted in Fig. 2. The MFI values for the Class I beads from the SN and BH laboratories were lower than those from the YH, CH, and SH research groups at the 1,000, 3,000, and 5,000 MFI cutoffs (all P<0.01). Additionally, at the 10,000 MFI cutoff, the values from the BH and SH groups were significantly lower than those from SN, YH, and CH (all P<0.01). Meanwhile, the MFI values for the Class II beads from the CH laboratory were significantly higher than those from SN, BH, and SH groups at the 1,000 and 3,000 MFI cutoffs (all P<0.01), and the MFI values from the SN group were significantly lower than those from BH, CH, and SH at the 10,000 MFI cutoff (all P<0.01).
2. Interlaboratory correlation of quantitative MFI values
Table 1 contains the pair-wise correlations of the results from the five laboratories. The results obtained from each bead were compared according to the four different MFI ranges and the six different sera tested. Correlation between the MFI values from the individual laboratories across the total MFI range was excellent as r values ranged from 0.947 to 0.991 for HLA class I and from 0.992 to 0.997 for HLA class II testing. However, analysis of the distinct MFI ranges indicated that the correlation between the results from the SN and SH groups at MFI ranges ≥8,000 was weak (r=0.347, P<0.05). Analysis of the HLA class 1 results obtained at each MFI range indicated that those obtained at the MFI range 3,000-7,999 exhibited higher correlation coefficients than those obtained at other MFI ranges. Conversely, the r values obtained for HLA class II antibody detection at the MFI ≥10,000 cutoff were significantly higher than those obtained at the 1,000-4,999 (P<0.001) and 5,000-9,999 ranges (P<0.001).
Furthermore, the correlation coefficients for the HLA class I data obtained by using serum 6 tended to be lower than those for the data from the other sera; however, this decrease was not statistically significant.
3. CV (%) of MFI values
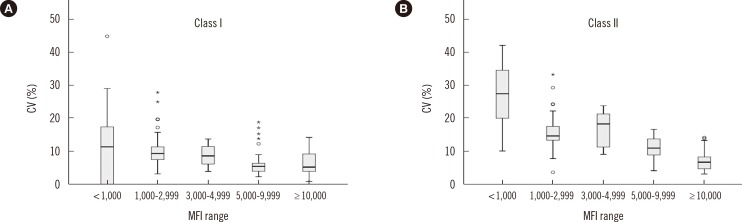
Analysis of the CV (%) values from the five laboratories according to the mean MFI values of each bead for HLA Class I and Class II antibodies are shown in Fig. 3. For Class I, the median CV (%) for the MFI values among five laboratories in the lower MFI range (<1,000) was significantly higher than those for the other MFI ranges (all P<0.001). For Class II, the median CV (%) for the MFI values among five laboratories in the lower MFI range (<1,000) was significantly higher than CV (%) for the MFI range 3,000-4,999 (P=0.003) and other MFI ranges (all P<0.001).
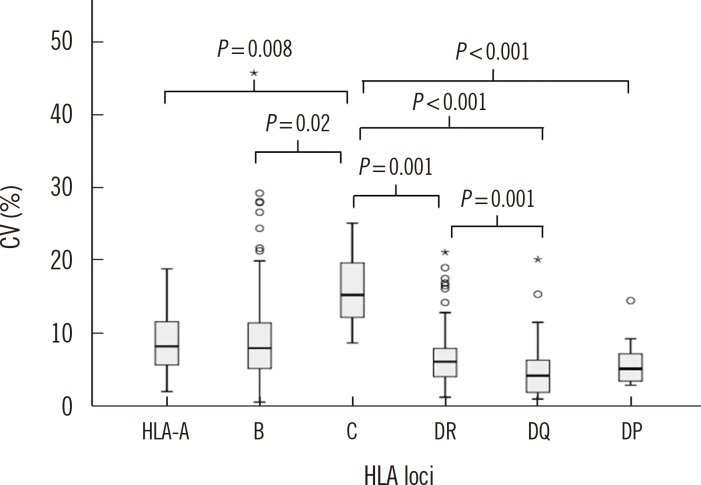
The CV for HLA class I data was higher than that for HLA class II data (16.7% vs. 11.7%, P<0.001), and the median CV (%) of MFI values from different HLA loci were 16.5% (HLA-A), 16.0% (HLA-B), 30.2% (HLA-C), 12.4% (HLA-DR), 8.7% (HLA-DQ), and 10.5% (HLA-DP) (Fig. 4). The CV for HLA-C data was significantly higher than the CVs for the other HLA loci (P=0.008 compared to HLA-A; P=0.02 compared to HLA-B; P=0.001 compared to DR; and P<0.001 compared to DQ or DP) (Fig. 4). Conversely, the CV for HLA-DQ data was significantly lower than the CV for the other loci, except HLA-DP (P<0.001 compared with HLA-A, B, or C; P=0.001 compared with DR). Meanwhile, the CVs for the MFI values indicated no statistical differences among various bead groups (data not shown), which were from the same lot and the same manufacturer.
Variance components analysis was used to assess random-effects on the data. These analyses indicated that interlaboratory variation comprised only 0.01% of the total variation within the HLA class I data (interlaboratory SD=37.3), and only 0.03% of the total variation in the HLA class II data (interlaboratory SD=79.2).
DISCUSSION
SAB testing is widely used because of its enhanced ability for DSA identification over the previously used panel reactive antibody test using purified HLA antigens. However, the lack of standardization of SAB testing across clinical laboratories can result in inconsistent outcomes and difficulties in the data comparison [10, 14, 15, 16, 17, 18]. Automated vacuum washing techinique can reduce the inter-operator variability [19]. Furthermore, there are several inherent limitations of SAB testing, including variable density of antigen binding, the possibility of conformational changes or denaturation of antigens when bound to the beads, and interference by endogenous or exogenous substances [3].
In a recent study, multiple laboratories obtained consistent MFI values when using LAB Screen SAB kits (One Lambda) from the same lot and identical protocols [13]. In a separate study, however, eight laboratories using identical reagents obtained a wide range of MFI values [20]. In this study, we investigated the interlaboratory variability only caused by laboratory conditions by comparing the SAB results from five laboratories using Lifecodes LSA Class I and Class II kits from the same lot and protocol. Like in the study using the One Lambda kit, the five laboratories participating in this study obtained consistent MFI values at multiple MFI cutoffs [13]. The pair-wise correlation coefficients for the MFI values throughout the entire MFI range were excellent. However, analyses of the correlation coefficients at each MFI range detected only weak correlations between the results from certain laboratories. These findings will need to be confirmed and those differences between laboratories need to be improved by further studies. Meanwhile, analysis of correlation coefficients according to the serum sample tested indicated that the correlations for the data from Class I beads mixed with serum 6 showed a tendency towards lower r values than those of the other sera. Notably, serum 6 also yielded higher MFI values when mixed with the negative control beads compared to the other sera (data not shown), which might affect the MFI values obtained from the test beads. To elucidate the high background signal obtained by using serum 6, SAB test was performed with serum 6 after dithiothreitol (DTT) treatment (final concentration of 0.005M DTT for 30 min at 37℃) in one of the participating laboratories; however, there was no significant difference in the results of this assay compared with those performed without DTT treatment. Other potential causes of high background signals, such as the presence of endogenous or exogenous antibodies, could not be ruled out in this study.
The proportions of discordant categorical results (positive or negative) at different MFI cutoffs were similar. However, from the analysis of the MFI values from individual laboratories with inconsistent results among five laboratories (Fig. 2), we can assume some differences of MFI values between certain laboratories; however, this conclusion also needs to be confirmed and if those differences exist, they should be improved by some efforts such as introducing automated vacuum washing in future studies. In addition, our study demonstrated increased variability for both Class I and II beads (median CV [%], Class I: 26.9 and Class II: 22.4) when the MFI cutoff was set at 1,000, which is consistent with the previous results [13]. Detection and measurement of DSA with low MFI values should be careful, as the total amount of DSA detected with low MFI can be used to extrapolate an MFI value that has clinical significance. It is also used for de novo monitoring of DSA levels post-transplant and for assessing the effects of antibody lowering therapies. Therefore, greater caution might be needed when comparing low MFI results across laboratories. Analysis of the MFI values according to the different HLA antigens indicated that the CV for HLA-C data was significantly higher than that for the data of the other HLA antibody species; however, the number of HLA-C antibodies analyzed in our study was much smaller (N=5) than the number of HLA-A (N=68) or B (N=124) antibodies analyzed. For the detection of HLA-DQ-specific antibodies, the beads contain both HLA-DQA1 and HLA-DQB1 antigens, which might explain the slightly lower CV for HLA-DQ compared with that for HLA-DR. However, further studies using larger number of samples are needed to clarify the effects of different HLA antigens on MFI values.
In this study, we analyzed background corrected MFI values to analyze interlaboratory concordance. This analysis was performed because the Pearson r values for background corrected MFI values were higher than those for raw MFI values (data not shown), which indicates lesser bias towards the use of background corrected MFI values when comparing the results from different laboratories. Various methods for normalizing MFI values have been recommended in previous studies [17, 21, 22]. Further studies comparing the effects of distinct data handling methods on the results obtained from products from different vendors would be helpful in terms of standardization of MFI values obtained by SAB analyses.
Although SAB testing has not been marketed as a quantitative assay, and lot-to-lot variability is still reported [17, 18], this method can be applied to help make appropriate clinical decisions if a universal reference standard is developed and standardized reagents, with minimal variation across lots, are available. In addition, the development of standardized protocols to diminish the effects of interfering substances and/or prozone could result in more consistent outcomes.
In conclusion, by using reagents from the same lot and identical protocols we obtained high levels of consistency and strong correlations between data from different laboratories. This consistency will allow for comparison of MFI data across institutions. However, there were still some biases in certain laboratories and in certain MFI ranges, which need to be addressed in future studies.

 XML Download