

 PDF
PDF ePub
ePub Citation
 Print
Print


INTRODUCTION
Osteoporosis (OP), a metabolic bone disease characterized by low bone mass and the deterioration of bone microarchitecture, has become more important as the average life span has increased [1]. OP occurs as a result of a pause in new bone formation and/or increased bone resorption. The imbalance between bone formation and resorption parallels the decreased estrogen production due to aging and/or menopause [2, 3]. Early diagnosis of OP by bone mineral density (BMD) is extremely important since treatment in the advanced phase of OP is not sufficient to prevent bone fracture. Currently, dual energy X-ray absorptiometry (DXA) is the gold standard diagnostic tool for BMD measurement [4, 5]. However, changes in BMD occur over a long period, and it is generally not useful to repeat BMD measurement until the end of the first or second yr of therapy [1, 5]. Determination of the bone turnover rate using biochemical markers is used to differentiate primary OP from secondary OP, identify cases at high risk of bone fracture, select treatment type, and in particular, evaluate the effectiveness of antiresorptive therapy [6, 7].
Osteocalcin (OC), a bone-specific protein synthesized by the osteoblasts in bone, is the major non-collagen protein in the bone matrix. It has a molecular weight of 5,800 Da and contains 49 amino acids, including 3 gamma carboxyl glutamic acid residues that facilitate the binding of OC to hydroxyapatite in bone [8]. The serum OC level, a sensitive marker of bone production, is associated with a high bone turnover rate and decreased BMD, and correlates well with histomorphometric indices of bone formation [9].
The fraction of OC that has undergone imperfect gamma-carboxylation is referred to as undercarboxylated osteocalcin (ucOC). Serum ucOC concentrations are a marker of both bone turnover and vitamin K status in bone [10]. Low dietary intake of vitamin K is related to elevated serum ucOC levels. Moreover, increased serum ucOC levels have been associated with an increased risk of hip fracture [11], and low BMD of the hip and spine in pre- and postmenopausal women [12].
Markers of bone turnover are considered useful diagnostic tools for the evaluation of bone formation and resorption. We measured serum OC and total serum alkaline phosphatase (ALP) activity as markers of bone formation. The objectives of this study were to determine the diagnostic utility of OC, ucOC, and ALP for predicting femoral neck, lumbar 1-4 (L1-4) spine, and lumbar 2-4 (L2-4) spine osteoporosis by taking into consideration age, body mass index (BMI), and menopausal status; investigate the association between serum OC, ucOC, and ALP levels with femoral neck, L1-4 spine, and L2-4 spine BMD values; determine the differences in serum OC, ucOC, and ALP concentrations between pre- and postmenopausal women of varying ages; and predict which patient group has the most rapid bone turnover rate.
METHODS
1. Study population
This study was accepted by the local ethics committee of Haydarpasa Numune Teaching and Research Hospital, and all investigations were carried out in accordance with the criteria of Helsinki II Declaration. Postmenopausal volunteers were chosen from the general ambulatory population of the surrounding community. Participants were questioned about their medical history and were excluded if they were taking oral contraceptives, on any special diet, using any drug that affects bone metabolism, smoking, exercising regularly, or had any metabolic disease or nutritional disorder that could affect bone metabolism. A control group of 40 subjects was selected from the hospital staff and their relatives who had no known disease or complaint, and was divided into 2 groups, 25-34 yr of age (group I, N=20) and 35-45 yr of age (group II, N=20). While 20 of the postmenopausal cases were within the first 5 yr after the onset of menopause (group III), the remaining cases (N=22) were 5 yr or more after the onset of menopause (group IV). Menopausal subjects were identified by a gynecologist based on the criteria described by WHO [13].
2. Biochemical parameters
Fasting blood samples were taken from all participants in plain tubes between 08:00 and 09:00 AM. Blood samples were centrifuged for 30 min at 1,300×g to separate the serum. ALP, calcium, and phosphorus were immediately analyzed by standard laboratory methods. Serum samples were stored at -20℃, and then OC, ucOC, and total acid phosphatase activity were analyzed on the same day that the samples were thawed at room temperature.
Osteocalcin was measured by an electrochemiluminescence immunoassay (E170 Modular System; Roche, Mannheim, Germany). OC and ucOC in serum were differentiated using BaSO4 powder as previously described by Sokoll et al. [14]. In this method, measurements were performed by incrementally increasing the amount of BaSO4 in the same serum pool in order to determine the optimum BaSO4 concentration that does not permit nonspecific binding, but binds all γ-carboxy glutamate residues. In an Eppendorf tube, 300 µL of serum was mixed with 100 mg of BaSO4 powder for 30 min at 4℃. It was then centrifuged for 2 min at 10,000×g and OC precipitated. Using the supernatant, ucOC was determined by the OC measurement method. The lower limits of detection for OC and ucOC were 0.5 ng/mL and 0.09 ng/mL, respectively. To improve the sensitivity of ucOC, the ucOC/OC ratio was also assessed with intact OC level correction.
3. Bone mineral density measurement
BMD was measured in all individuals at the femoral neck of the left leg, L1-4 spine, and L2-4 spine using DXA (Lunar DPX-L; Lunar, Madison, WI, USA). Osteoporosis and osteopenia were established according to the T score; a T score above -1 was accepted as normal bone mass, between -1 and -2.5 was considered osteopenia, and below -2.5 was considered osteoporosis [13]. BMD was measured on the same day that blood samples were taken for the biochemical parameters.
4. Statistical analysis
All of the statistical analyses were performed using the SPSS version 15 software package for Windows (SPSS Inc., Chicago, IL, USA) and MedCalc software for Windows (MedCalc Software Inc., Mariakerke, Belgium). Kolmogorov Smirnov analysis was performed to evaluate whether the distribution of values was normal or not. If distribution was normal, one-way ANOVA and Tukey's HSD tests were used for intergroup comparison to determine the cause of the group difference. In contrast, Kruskal-Wallis Variance analysis was performed to demonstrate the differences among the 3 groups, and the Mann-Whitney U-test was used for pairwise comparison of the median values of groups to determine statistical significance. Pearson or Spearman correlation coefficients were preferred according to the distribution of variables to assess the association between parameters. The diagnostic accuracy of the evaluated variables was assessed by calculating the areas under the ROC curves. We have performed the statistical analysis for the comparison of ROC curves using MedCalc software. Multiple logistic regression analyses were carried out to determine which single parameter is most discriminative for OP. For each outcome, the models included terms for age, BMI, OC, ucOC, total acid phosphatase, ALP, calcium, and phosphorus. All of the reported P values were based on 2-sided tests, and those less than 0.05 were considered statistically significant.
RESULTS
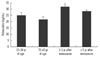
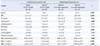
Subject characteristics are summarized in Table 1. The ages of the postmenopausal women ranged from 43 to 74 yr old (mean±SD: 58±8), while the premenopausal women's ages ranged from 25 to 44 yr old (mean±SD: 35±6). Two and six osteoporotic women were observed in the first 5 yr after menopause group, and more than 5 yr after menopause group, respectively. The mean serum OC, ucOC, and ALP concentrations were significantly higher in postmenopausal women than in premenopausal women (Table 1). Serum OC and ucOC concentrations differed significantly among the groups (P=0.012 and P=0.003, respectively). Significant difference was observed between group III and group II for OC (Fig. 1, P=0.001), and between group III and both group II (P=0.002) and group I (P=0.038) for ucOC. The ucOC/OC ratio differed slightly, although it was not statistically significant (P=0.072).
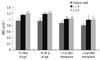
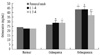
Comparison showed that the BMD values differed significantly among the groups (Table 1 and Fig. 2). Serum OC levels for the groups based on the T score of femoral neck, L1-4 spine, and L2-4 spine BMD are shown in Fig. 3. Comparisons of the evaluated parameters among the groups according to the BMD T score are shown in Table 2-4. Femoral neck BMD values were inversely correlated with age and serum OC level (r=-0.358, P= 0.004 and r=-0.296, P=0.016, respectively). Highly significant inverse correlations were observed between L1-4 spine BMD values and age, serum OC, ucOC, and ALP values (r=-0.425, P<0.001; r=-0.431, P<0.001; r=-0.349, P=0.001; and r=-0.393, P<0.001, respectively). In addition, L2-4 spine BMD values were inversely correlated with age, and serum OC, ucOC, and ALP levels (r=-0.459, P<0.001; r=-0.423, P<0.001; r=-0.299, P=0.015; and r=-0.393, P<0.001, respectively).
1. ROC analysis
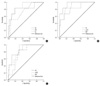
ROC curve analysis was used to determine the discriminative power of each evaluated parameter for osteoporosis. The area under the ROC curves (AUC) based on femoral neck osteoporosis (AUC=0.882, P=0.002 for ALP; AUC=0.829, P=0.008 for OC; AUC=0.761, P=0.034 for calcium), L1-4 spine osteoporosis (AUC=0.949, P=0.003 for OC; AUC=0.873, P=0.012 for ALP; AUC=0.845, P=0.021 for ucOC), and L2-4 spine osteoporosis (AUC=0.866, P=0.003 for OC; AUC=0.819, P=0.010 for ALP; AUC=0.814, P=0.011 for ucOC) were calculated separately for significant variables (Fig. 4). There were no statistically significant differences in comparison of the ROC curves between pairwise markers except for OC and ucOC to determine the OP. This significance was observed in L1-4 OP (P=0.007).
2. Predictors of osteoporosis
A multiple logistic regression analysis revealed that OC has the highest predictive value for OP (P=0.029, P<0.001, and P=0.002 for femoral neck, L1-4 spine osteoporosis, and L2-4 spine osteoporosis, respectively) when all of the evaluated biochemical parameters, age, BMI, and menopausal status of women were included in the equation.
DISCUSSION
In the present study, serum OC, ucOC, and ALP concentrations were significantly higher in women in the postmenopausal group than in those in the premenopausal group. The highest serum OC, ucOC, and ALP concentrations were observed in patients within 1-5 yr after the onset of menopause, probably due to increased bone turnover rate. Osteocalcin, with or without ucOC and ALP, could be a useful diagnostic tool to select patients with probable femoral neck, L1-4 spine, or L2-4 spine osteoporosis for BMD measurement.
BMD is the most valuable diagnostic tool to differentiate patients with OP from healthy individuals. However, only changes that take place over long periods of time can be measured by BMD, and changes due to therapy cannot be immediately observed. Biochemical bone markers are non-invasive and less expensive diagnostic tools that are beneficial for diagnosis and treatment follow-up of metabolic bone diseases. In addition, while BMD measurements reflect the static status of bone tissue, biochemical bone markers show the dynamic status [1, 5, 14, 15]. Therefore, using BMD measurements together with these markers can make the diagnosis, risk evaluation, and therapy of OP more effective.
Osteocalcin is a product of osteoblasts that is considered a marker of bone formation [9]. However, osteocalcin is also released from the bone matrix into blood during bone resorption, suggesting that osteocalcin is also a marker of bone turnover [16]. Therefore, the higher serum osteocalcin levels and ALP observed in women within the first 5 yr after the onset of menopause may reflect an increased bone turnover rate rather than simply increased bone formation, and thus may be associated with an increased risk of bone fracture and OP.
Although the amount of ucOC is considered a sensitive measure of vitamin K status in bone, we did not measure the concentration of vitamin K. However, according to the medical history of our study population, they seemed to have healthy vitamin K statuses. In addition, vitamin K deficiency increases with age; but, in the present study, older (group IV) patients had lower ucOC levels than younger (group III) patients, although there was also no significant positive correlation between ucOC and age. Therefore, we did not consider vitamin K deficiency in our study population.
Within a woman's life span, 75% of total bone loss is seen during the postmenopausal period due to estrogen deficiency (52-66%) and aging (34-48%). Bone loss in early postmenopausal women is more rapid due to more rapid osteoporosis, and 30% of total body bone mass is lost in the first 15-20 yr after the onset of menopause [13, 17, 18]. Based on our findings, the rate of bone loss in postmenopausal women seems to be greater within the first 5 yr after the onset of menopause. OC, ucOC, the ucOC/OC ratio, and ALP concentration were significantly higher in osteoporotic women compared with non-osteoporotic women. Therefore, these results could influence their corresponding therapeutic strategies, by adding antiresorptive drugs for peri- and early postmenopausal women. In the current study, we performed a multiple logistic regression analysis to control for probable confounding variables such as BMD, age, and the menopausal status of women. According to the ROC and multiple logistic regression analyses, OC may be a useful diagnostic tool to select patients with probable OP and to effectively personalize their therapy.
Plantalech et al. [19] reported that total OC and ucOC serum levels were significantly higher in postmenopausal women than in premenopausal women, as was observed in our study. We considered that while the bone turnover rate is steady in premenopausal women, it was induced during the postmenopausal period; thus, OC and ALP concentrations were elevated.
Serum ucOC is expressed as a percentage of total OC. This ratio seemed to be increased in postmenopausal women compared with premenopausal women; but, the increase was not statistically significant (P=0.072). Szulc et al. [20] stated that ucOC could be a predictor of hip fracture risk in elderly women, because serum ucOC levels were higher in 70-101-yr-old women than in a younger premenopausal control group, and 23% had values greater than the normal premenopausal range. In a study of women aged 20-90 yr, Knapen et al. [21] observed a strong inverse relationship between serum ucOC/OC ratio and femoral neck BMD levels during the first 10 yr after the onset of menopause; however, we did not observe such a relationship. Yasui et al. [22] also did not find an association between serum ucOC and L1-4 spine BMD; however, they observed higher ucOC levels in perimenopausal women than in others. In the present study, the difference in this ratio among the groups was not significant, because there was a fewer number of patients in each subgroup.
The present study has some limitations. First, the number of the women with osteoporosis was low. Second, we did not measure other specific bone turnover markers that could support the importance of the first 5 yr after the onset of menopause for OP and OP therapy.
In conclusion, the observations in this study suggest that measuring serum osteocalcin concentration may be helpful to monitor follow-up changes that currently cannot be assessed with BMD, and the elevation of osteocalcin levels could be a more efficient method to detect patients with fast bone turnover rates after the onset of menopause. Determination of osteocalcin levels in serum could be helpful to predict probable femoral neck, L1-4 spine, and L2-4 spine osteoporosis before performing BMD.


 XML Download