

 PDF
PDF ePub
ePub Citation
 Print
Print


In the nineteenth century, Helmholtz found optical errors that could not be corrected using existing optical theory.1 These came to be known as high order aberrations (HOAs). The twentieth century introduced the Zernike polynomials, which could quantitatively analyze optical HOAs in the human eye.2 As skills developed for measuring wavefront, it was discovered that HOAs increased following excimer laser ablation of the cornea during refractive surgery.3
Aberrometers are currently the most important tools for estimating optical conditions so that a more complete understanding of optical error can be quantified and corrected.4
Aberrometry presents larger applications than just enhancing the quality of the ablation zone in an excimer laser treatment, so the choice of the most appropriate machine depends mainly on the clinical practice. Making a practical comparison between the available devices is not an easy task because of the variety of principles used, such as ray tracing, Hartmann-Shack, Tscherning, and automatic retinoscopy.
The purpose of this study is to provide a number of technical and practical parameters that may be useful in choosing an aberrometer for daily clinical practice. The total optical aberration of an eye is the sum of all rays entering and exiting the eye. Internal aberration refers to light rays that are mainly disturbed in the anterior segment. Such a comparison is needed to accurately analyze where in the eye light rays are most distorted.
We measured ocular total and internal aberration using a Visual Function Analyzer (VFA; Tracey Technology) (based on ray tracing; can be used with the EyeSys Vista corneal topographer) and an OPD Scan (ARK 10000; Nidek) (based on automatic retinoscopy; provides integrated corneal topography and wavefront measurement in one device).
We note that our results only represent the devices as they were made available to us during the study period. Because the devices undergo constant alteration and improvement, we advise potential users to verify all parameters for each model and device.
Subjects and Methods
Twenty-seven subjects were included in this study, none of whom had any history of ocular abnormalities or prior ocular surgery. A history of any kind of contact lens wear in the past month excluded the subject from the study, and eyes with uncorrectable visual acuity below 20/20 were also excluded. The patient group had an average age of 27±7 years. Tropicamide 0.5% was used when appropriate to test response to pupillary dilatation.
The two aberrometers compared in this study were the iTrace (Tracey Technology) and the OPD Scan (Nidek, Japan). Total aberration and internal optic aberration were measured with each instrument at pupil diameters of 4.0 and 6.0 mm. These pupil sizes were chosen to represent mesopic and scotopic conditions, respectively. At each pupil diameter, RMS total aberration, RMS high order aberration, spherical aberration (Z4,0), coma aberration (Z3,-1, Z3,1), trefoil aberration (Z3,-3, Z3,3), and the refraction parameters were measured by each aberrometer.
Because the wavefronts are often expressed in terms of Zernike polynomials, a selection of these polynomials can easily be used for comparison purposes. The OPD Scan and iTrace allow the user to define the pupil size at which aberrations are to be measured. We used fixed pupil sizes of 6.0 mm and 4.0 mm.
Direct statistical comparison of the parameters was done using a paired t-test with a significance level of 95%. We used SPSS version 13.0 (SPSS Inc., CA) for Windows.
Results
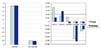
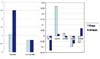
At a pupil diameter of 4.0 mm, measuring total aberration of the entire eye yielded similar coefficients of variation for the two aberrometers, with the exception of the fourth order spherical aberration (Z4,0) (p<0.001) (Table 1, Fig. 1). Comparing the internal optic aberration at a pupil size of 4.0 mm, the mean values of total RMS (p<0.001), 3rd order aberration, coma (Z3,-1) (p=0.01), and trefoil (Z3,3) (p<0.001) showed significant differences between the iTrace and OPD Scan, as shown in Table 2 and Fig. 2.
At a pupil size of 6.0 mm, the two instruments showed similar total aberrations, whereas the internal optical aberrations measured by the two instruments were found to have significant differences for the mean values of total RMS (p<0.001), spherical aberration (Z4,0) (p=0.01), and coma (Z3,-1) (p<0.001).
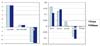
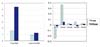
In a comparison of total aberration and internal optic aberration using the OPD Scan and iTrace, both devices were shown to obtain more similar measurements when measuring total aberration rather than internal optic aberration for both 4.0 and 6.0 mm pupils (p=0.01, p=0.01, respectively) (Tables 3, 4 and Fig. 3, 4).
Discussion
A meaningful measure of HOA is a prerequisite for application of wavefront technology to clinical practice. In the present study, we explored the agreement of HOA measurements between two available clinical aberrometers. The results showed a significant difference in HOA data between the aberrometers. Because there is no gold standard to measure HOAs, we cannot make any inferences regarding the accuracy of the HOA data from the two devices. In fact, the similar values of the coefficient of variation of the two aberrometers suggest that the devices had comparable measurement variations.
The ray tracing principle is a serial, double-pass method using forward projection that can be implemented in both an objective and subjective manner. Ray tracing uses a narrow laser beam that is directed into the eye parallel to the eye's line of sight by means of an x-y scanner. Once in the eye, local aberrations in the beam's entry position cause a focal shift of the retinal image with respect to a certain reference position. Using a beam splitter and lens, the retinal image is captured on a linear array of photodetectors and is made available for further processing. The x-y scanner, comprising 2 separate scanners for the x- and y-directions, repeatedly moves the beam to a new entry position until homogeneously spread measurements are available for the whole pupil area. The uncomplicated nature of the technique makes it robust for extreme aberrations. The automatic retinoscope is an automated version of the handheld retinoscope and is implemented in an objective, serial, and double-pass fashion. It uses focal shift in a different way, starting with the observation that the retinal image of a light beam coming from a superior direction is located below the optical axis in a myopic eye and above the optical axis in a hyperopic eye. Because the retina can be considered a spherically concave mirror (reflecting about 4% of incident light), the beam is reflected back in more or less the original direction in a myopic eye. However, in a hyperopic eye the reflection is directed to the opposite side of the pupil. Moving the incident beam along a certain pupillary meridian (indicated by arrows in the figure) will result in a reflected beam that goes in the same or opposite direction as the incident beam. The difference in direction and the ratio between the speed of the incident beam and that of its reflection can then be used to estimate the ocular refraction along this meridian.
Because HOAs are easily measured in the clinical setting, supranormal vision may be achieved by correcting HOAs. Ophthalmic researchers have become interested in establishing fundamental information, such as the range of aberrations in normal populations5,6 and testing repeatability.7,8
There are limitations to our study. The two devices calculate the various HOA data for specific pupillary size constraints set by the examiner. The initial HOA captured in real-time is not depicted by the device until the examiner specifies a pupil size. Such calculated data may not truly reflect the HOA. The results presented here reflect this differing method of data acquisition and processing.
Total aberration measured by the iTrace and OPD Scan showed more correlation between the two devices than did measurement of internal optical aberration. Also, scanning with the pupil at 6 mm showed more consistent interdevice correlation than did scanning at a pupil size of 4 mm. This can be intuitively explained. Since internal optical aberration is defined as the difference of aberration resulting at the cornea from the total aberration, even tiny errors during alignment, acquisition, or data processing guarantee a greater margin of error for internal optic aberration because it requires two separate measurements. In addition, the iTrace aberrometer requires an experienced examiner for data acquisition since total aberration and corneal aberration cannot be obtained with a single scan. Rozema et al. and Liang et al. recently compared six and three aberrometers, respectively, and described globally similar results among the compared devices.9.10
In conclusion, total aberration may be compared between the two devices since they seem to show similar results. Internal optical aberration seems to be more difficult to directly compare between the two devices studied in this article. Also, scanning for wavefront aberrations with the pupil at 6 mm showed a more similar pattern of HOA between the two devices. Thus, total aberration with the pupil at a diameter greater than 6 mm seems to be a justifiable method for comparing interdevice correlation between the OPD Scan and iTrace.


 XML Download