

 PDF
PDF ePub
ePub Citation
 Print
Print


Many experimental studies involving rats and monkeys demonstrate retinal ganglion cell layer loss when intraocular pressure is increased.1-3 The loss of ganglion cells was also proportionate to the cumulative intraocular pressure. In addition, about 50% of ganglion cells of the entire retina are present near the fovea.4 Therefore, measuring the retinal ganglion cell layer loss at the posterior pole could assist in measuring the peripapillary retinal nerve fiber layer (RNFL), and may also be important in the detection of glaucoma. Loss of the retinal ganglion cell layer at the posterior pole may be evaluated indirectly by measuring the retinal thickness.
The retinal thickness analyzer (RTA; Talia technology, Inc., USA) is an ophthalmic imaging device used for the mapping and quantitative measurement of retinal thickness and disc topography. It projects a Green He-Ne laser to the fundus, and the reflected laser is scanned by a charge-coupled device camera. There are two peak reflections at the level of the internal limiting membrane and the retinal pigment epithelium and the retinal thickness is calculated using these two peak reflections. Therefore, the RTA can be used to measure the retinal thickness at the posterior pole. Substantial loss of retinal ganglion cells occurs in the zone surrounding the fovea in glaucomatous eyes, so the RTA may be very useful for diagnosis of glaucoma.5,6 Clinically, the RTA may also be valuable in the diagnosis of many macular diseases, i.e., macular edema, macular holes, or epiretinal membranes.7-9
In addition to the RTA, there are many instruments available for early glaucoma detection, such as the GDx VCC scanning laser polarimeter (GDx VCC; Laser Diagnostic Technologies, Inc. San Diego, CA), Stratus OCT optical coherence tomography (Stratus OCT; Carl Zeiss Meditec Inc, Dublin, CA), and Heidelberg retinal tomograph II confocal scanning laser ophthalmoscopy (HRT II; Heidelberg Engineering, Heidelberg, Germany).
The purpose of this study is to assess the relationship between the optic disc and posterior pole retinal thickness parameters using the RTA, GDx VCC, Stratus OCT, and HRT II.
Materials and Methods
Subjects
The primary open angle glaucoma patients who were examined with RTA at Severance Hospital, Yonsei University College of Medicine were retrospectively identified from a patient database of the institute. Both eyes of each patient were included in the study, provided they satisfactorily fulfilled the entry criteria. Each eye had a best corrected visual acuity of 20/25 or better, a spherical equivalent refractive error between -5 and +5 diopters, clear ocular media with no clinically significant cataract, a normal open angle, and no previous intraocular surgical history. The patients had no other coexisting ocular diseases such as diabetic retinopathy, retinal venous occlusion, or epiretinal membranes.
The diagnosis of glaucoma was based on the presence of typical glaucomatous optic disc damage on stereoscopic examination (as judged by a glaucoma specialist, Y.J. Hong). The presence of a glaucomatous visual field loss, as measured by the standard automated perimetry (SAP; Humphrey Field Analyzer II, 30-2 Swedish interactive threshold algorithm standard strategy; Carl Zeiss Meditec Inc., Dublin, CA), also constituted a diagnosis of glaucoma.
Measurements
All 29 subjects were examined with the RTA. Among them, 17 patients (30 eyes) underwent imaging with the RTA and GDx VCC, 17 patients (30 eyes) underwent imaging with the RTA and Stratus OCT, and 14 patients (24 eyes) were examined with the RTA and HRT II.
The RTA was used to determine the retinal thickness measurement at the posterior pole and was performed by one examiner. Thirty minutes before the examination, the pupil was dilated with mydriatics. Refractive error and corneal curvature were measured with an automated refract-keratometer (RK3, Canon, Tokyo, Japan). The Green He-Ne laser slim beam (543 nm) was projected on the retina, and a backscattered laser was detected with a charge-coupled device camera. The backscattered laser peaks twice at the level of internal limiting membrane and retinal pigment epithelium, and these two peaks were used to calculate the retinal thickness. A 3×3 mm area composed of 16 optical cross sections was scanned. Five such scans were obtained at the macula, three scans at the disc, and an additional five scans in the peripapillary area. The retinal thickness map was reconstructed and the parameters were calculated. All these data were analyzed by software version 4.20. If the reconstructed image was not of high quality, we either reexamined or excluded the image.
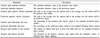
We divided the RTA parameters into two groups: the optic disc parameters and the posterior pole retinal thickness parameters. Optic disc parameters included the disc area, cup area, cup/disc area ratio, rim area, cup volume, rim volume, mean cup depth, maximum cup depth, cup shape measure, and height variation contour. The posterior pole retinal thickness parameters (Table 1) included the posterior pole minimum thickness (PPMT), the perifoveal minimum thickness (PFMT), the posterior-pole superior/inferior asymmetry (PPSIA), the perifoveal superior/inferior asymmetry (PFSIA), the posterior pole abnormally thin area (PPAT), the perifoveal abnormally thin area (PFAT), the posterior pole number of thin clusters (PPNT), and the posterior-pole pattern deviation (PPPD). Ocular fundus scanning was completed using the GDx VCC, Stratus OCT, and HRT II, and is described elsewhere.10-15 All tests were performed by one examiner in a single day.
Data Analysis
We compared the optic disc parameters of the RTA with those of the Stratus OCT and HRT II. We also compared the posterior pole retinal thickness parameters of the RTA with those of the GDx VCC and the Stratus OCT. Pearson correlation coefficients were calculated and p-values less than 0.05 were considered statistically significant. Statistical analyses were carried out using the SPSS program for Windows, version 12.0 (SPSS Inc, Chicago, IL).
Results
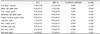
Thirty eyes of 17 patients underwent imaging with RTA and GDx VCC, 30 eyes of 17 patients underwent imaging with RTA and Stratus OCT, and 24 eyes of 14 patients underwent imaging with RTA and HRT II. Differences in age and intraocular pressure between the groups were not statistically significant (Table 2).
Among the RTA and the Stratus OCT optic disc parameters, the disc area, cup area, cup/disc area ratio, and cup volume (except rim area) showed a statistically significant correlation (Table 3); cup volume proved to be the best correlated (R=0.780, p<0.001).
Among the RTA and HRT II optic disc parameters, the disc area, cup area, cup/disc area ratio, cup volume, rim volume, mean cup depth, maximum cup depth, cup shape measure, and height variation contour (except rim area) showed a significant correlation (Table 4); cup shape measurement was the best correlated (R=0.896, p<0.001).
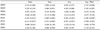
Table 5 shows the correlation between the posterior pole retinal thickness of RTA and the GDx VCC RNFL thickness parameters. Among the RTA parameters, the PFMT, PPAT, PFAT, and PPNT were significantly correlated with the temporal-superior-nasal-inferior-temporal (TSNIT) average of the GDx VCC. PPAT and PFAT were significantly correlated, with a superior average of GDx VCC. PPAT, PFAT, and PPNT were significantly correlated, with an inferior average of GDx VCC. Among the parameters, the PPAT and inferior average showed the best correlation (R=-0.596, p=0.001).
When the RTA posterior pole retinal thickness parameters and the Stratus OCT RNFL thickness parameters were examined (Table 6), the PPAT and PFAT were found to be significantly correlated with the superior maximum, inferior maximum, and inferior average. Additionally, PPAT was correlated with the average thickness. Among them, the PPAT and inferior maximum were the best correlated (R=-0.489, p=0.006).
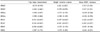
When the RTA posterior pole retinal thickness and HRT II RNFL thickness parameters were examined (Table 7), the PPAT and PFAT were significantly correlated with cup shape measurements, height variation contour, and mean RNFL thickness. Additionally, the PFMT and PPNT were correlated with the cup shape measurement. The PPMT was correlated with the height variation contour. Among these two parameters, the PFMT and cup shape measurement showed the best correlation (R=-0.565, p=0.004).
Discussion
In this study, the RTA optic disc and posterior pole retinal thickness parameters were correlated with the GDx VCC, Stratus OCT, and HRT II RNFL thickness parameters. Regarding the optic disc parameters, the cup volume of the RTA was best correlated with the Stratus OCT and HRT II. Regarding the posterior pole retinal thickness and the RNFL thickness parameters, the PPAT of the RTA were best correlated with the inferior average of GDx VCC and the inferior maximum of Stratus OCT. The PFMT of the RTA and cup shape measurement of HRT II were best correlated.
However, the mean values of the parameters were slightly different, perhaps due to the use of different kind of lasers and analysis methods. Comparing the RTA with the HRT II, the RTA projects a 543 nm He-Ne laser, detects reflection at the vitreoretinal surface, and constructs the optic disc topography. In contrast, the HRT II uses a 675 nm diode laser, detects reflection, and constructs the optic disc topography. In both tests, the cup and disc are divided by reference plane (which lies in 50 µm posterior to papillomacular bundle), and the disc margin is drawn by the examiner. After these processes, the optic disc parameters of the RTA and HRT II are calculated. The average means of the parameters may be different due to the individual examiners, who draw the margin of the optic disc.16 Since the same method of calculating the parameters was used and the parameters proved to be strongly correlated,, these differences in the mean values could be secondary to the different kind of lasers in each instrument. The Stratus OCT uses an 843 nm infrared light beam and generates a cross-sectional image of the retina. It uses the end of the RPE as the disc margin and finds a neural rim directly from the cross-sectional image. Therefore, methods of calculating optic disc parameters between the RTA and Stratus OCT are different, and as such, may produce a difference in the means. Although the optic disc parameters of the RTA differ numerically with those of the Stratus OCT and HRT II, they are significantly correlated. Therefore, optic disc parameters of the RTA are useful, as well as those of the Stratus OCT and the HRT II.
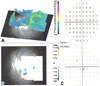
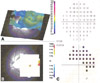
Results of this study demonstrate that the peripapillary RNFL is significantly correlated with the posterior pole RNFL retinal thickness. This indirectly represents the retinal ganglion cell layer and RNFL in the posterior pole, and therefore the posterior pole parameters of the RTA may be a useful indicator of glaucoma. These results also support other studies.5 Substantial loss of retinal ganglion cells occurs in the zone surrounding the fovea in glaucomatous eyes, and the PFMT is a useful indicator of glaucoma.5 Three eyes showed a thin PFMT but normal NFI, TSNIT average, superior average, and inferior average range (Fig. 1). They also showed decreased sensitivities in visual field testing at the corresponding area of thinned retina (Fig. 2). These findings suggest that localized loss of ganglion cells in patients with glaucoma can precede an arcuate defect of the RNFL at the posterior pole. In the previous studies, it was demonstrated that loss of ganglion cell layer may occur before glaucomatous visual field changes.17,18 The RTA could be more advantageous than other instruments in certain circumstances for detecting early glaucomatous changes. On the other hand, three cases demonstrated a thick PFMT, but glaucomatous peripapillary RNFL parameters in the GDx VCC. In these cases, the entire posterior pole retinal thickness was increased on the RTA image map. This phenomenon may be due to the variation of perifoveal retinal cell density, which occurs in less than ten percent of the normal population.19 However, the diagnosis of glaucoma is not difficult because the patients have the characteristic glaucomatous optic disc and visual field changes (Fig. 2).
Of note, between the RTA and HRT II parameters, the PFMT is significantly correlated with the cup shape measurement, which is the most valuable indicator for detecting glaucoma in HRT.20,21 The posterior pole abnormally thin area and perifoveal abnormally thin area were also significantly correlated with cup shape measurement, height contour variation, and mean RNFL thickness. Therefore, these parameters may be useful indicators of glaucoma.
Our study is not without limitations. Our sample size may not have been sufficient to detect small but real relations among the parameters that we found were not associated with each other. Analyses of several parameters were suggestive of an association, but the sample size was too small for definitive conclusions. In addition, our study design which allowed the inclusion of both eyes of one person if each eye satisfied the inclusion criteria, may have influenced the results of statistical analysis.
In summary, the RTA optic disc parameters have different numerical values as compared to that of the Stratus OCT and HRT II. However, other significant correlations between the RTA, Stratus OCT and HRT II could prove to be valuable in clinical use. In addition, the PPAT and PFMT of the RTA were significantly correlated with the peripapillary RNFL parameters of the GDx VCC, Stratus OCT, and HRT II and these parameters could be used as indicators for detecting glaucoma.


 XML Download