

 PDF
PDF ePub
ePub Citation
 Print
Print


The color vision tests currently used in practice include pseudoisochromatic plates such as the Ishihara test1,2 and the Hardy-Rand-Rittler (HRR) test,3 and color arrangement tests such as the Farnsworth-Munsell (FM) 100 hue test.4 The HRR test is valuable in grading color defects and identifying tritans. The Ishihara and HRR tests are often used together, the former for red-green screening and the latter for tritan screening and grading. The FM 100 hue test is designed to detect all types of color vision defects from mild red-green defects to total achromatopsia, and measures the axis of color confusion. This test gives information on differential diagnosis and disease progression, but takes longer to complete.
The pseudoisochromatic plates test is the most popular technique for screening and diagnosis of abnormal color vision. It is very effective in screening, especially for red-green color vision deficiency. Dichromats and anomalous trichromats fail most of the plates and only slight protans and deutans are able to read some plates correctly.
These tests consist of color plates or color bars. They are usually durable for several years but exposure to direct sunlight or soiling from handling over several years cause fading of the color plates or color bars. Although such change in the color plates or bars from their original color could be a source of error and may affect the sensitivity of the test or the interpretation of the test results, little is known about the quantitative or qualitative characteristics of color change in the pseudoisochromatic plates as they age.
The aim of this study was to quantify the color changes in pseudoisochromatic plates with aging and to determine whether those changes have any directional property in the CIELab color model system.
Materials and Methods
Three sets of Ishihara pseudoisochromatic plates with different published years were tested. They were designated as set 1 (Ishihara's tests for color-blindness, Handaya Co., Tokyo, Japan, 2001), set 2 (Ishihara's tests for color-blindness, Concise Ed, Kanehara Shuppan Co., Tokyo, Japan, 1983), and set 3 (Ishihara's tests for color-blindness, Handaya Co., Tokyo, Japan, 1971).
Thirty-two dots with 13 different colors, totaling up to 96 dots, were randomly chosen from each set for color measurement. Dots from each set were matched for their position in the test plates. The dot subjects were chosen among large sized dots from either background or target considering the aperture size (3 mm) of the spectrophotometer.
The color of each subject dot was measured with a spectrophotometer (CM-503i, Minolta, New Jersey, U.S.A.).5,6 Each plate with target dots was adjusted to the measurement aperture of the spectrophotometer after calibration. D65 was used as the measurement setting with CIE standard illuminants and 10° as the observer setting. The spectrophotometer was connected to a PC through a serial port (RS-232C) and the colorimetric values were analyzed with Spectra Magic software version 1.01 (Cyber Chrome Inc., Minolta, New Jersey, U.S.A.).
The measured colorimetric variables were L* (lightness), a* (red-green), b* (blue-yellow), and chroma values with the CIELab color model and hue values from the HSB/HLS color system.
Color model
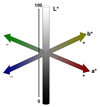
The CIELab color model was used for colorimetric measurement and statistical analysis in this study. CIE stands for Commission Internationale de l'Eclairage (International Commission on Illumination), and a specific color in this system can be presented on three axes - L*, a*, and b* - coordinates. L* ranges from 0 (black) to 100 (white), and the values represent lightness. Positive a* values represent amounts of red and negative a* values represent green. On the b* axis, amounts of yellow are represented as positive while green is negative (Fig. 1).7
Results
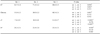
Ninety-six dots from the three sets of Ishihara test were measured. As shown in Table 1, there were significant differences in brightness and color values among the three sets of Ishihara pseudoisochromatic plates. The dots were much brighter in the older version of the color test plates. Compared with set 2 (71.0±1.2) and set 3 (68.6±1.5), L* (lightness) value was significantly lower (darker) in set 1 (64.7±1.4). Although L* value was higher in set 2 than in set 3, the difference was not statistically significant. Chroma value was also lower in set 1 (33.9±2.2) than in set 3 (40.5±2.3), but there was no significant difference between sets 1 and 2, or between sets 2 and 3. Increasing redness in the older version of the color test plates was observed from the increasing tendency in a* value from set 1 to set 3 (7.4±2.9 in set 1, 8.9±2.8 in set 2 and 11.9±2.7 in set 3; set 1 vs. set 3, p<0.001; set 2 vs. set 3, p<0.007). Yellow values on the blue-yellow axis were also increased in the older version. The values on the b* axis were significantly higher in set 3 (35.4±2.5) than in set 1 (28.3±2.5).
Discussion
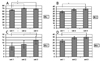
Our results showed that colorimetric values were significantly different among the three different sets of test plates and that these differences could be attributed to plate aging, as shown in Fig. 2. The present study also demonstrated a directional shift of the colorimetric values of Ishihara pseudoisochromatic plates with their aging on the CIELab color model system. They became brighter, and showed a tendency to shift to red on the red-green axis and to yellow on the blue-yellow axis. These changes seem to result from fading of the prints, similar to those changes observed in old photographic pictures which usually become brighter and have increased red tone compared to the original ones.
Ishihara pseudoisochromatic plates are commonly used in practice for detecting and classifying abnormal color vision.8 Pseudoisochromatic plates are based on hue discrimination and describe the amount of change in wavelength that is required for detection. These plates are designed in four ways: (1) Transformation plates where a person with normal color vision sees one figure and a color vision deficiency (CVD) person sees another, (2) vanishing plates where a person with normal color vision sees the figure while a CVD person does not, (3) hidden-digit plates where a person with normal color vision does not see a figure while a CVD does, and (4) diagnostic plates which are designed to be seen by normal subjects while a CVD person sees one number more easily than another. Discrimination of colors in the pseudoisochromatic plates does not only rely on the colorimetric value of individual dots but also on the difference or the similarity of colorimetric values between surrounding dots. Thus, not only must pairs of inks be carefully selected to lie upon appropriate isochromatic lines, but the luminance contrast between the two colors must be kept within 5%.9
Fading or soiling of materials with aging may be inevitable with any conventional color test, such as Ishihara pseudoisochromatic plates, HRR test, or FM 100 hue test. There have been efforts to simulate or improve the color test with computer by combining principles of traditional methods and modern technology to resolve this issue. Our previous studies have shown that the computerized color vision test has good correlation with conventional tests.10-12 A computer-based color test could have an advantage over traditional color tests in that it can be calibrated using the same setting at different sessions and hence maintain consistency permanently.
Although our results showed significant changes in the colorimetric values of the pseudoisochromatic plates with their aging, the clinical significance of such changes was not investigated in this study. Further research to clarify the impact of these changes on the clinical results of color tests is now proceeding.
 XML Download