

 PDF
PDF ePub
ePub Citation
 Print
Print


Abstract
Purpose
Reading speed is one of the methods used to measure near visual function. Although several versions of reading charts in different languages have been introduced, there is no Korean version of the reading chart yet. Therefore, we investigated the reading speed of normal-sighted Korean people using a recently developed reading speed application for the iPad tablet in Korea.
Methods
Normal-sighted participants without presbyopia were included and a third generation retina display iPad was used to measure reading speed. The iPad screen was set to maximum brightness and the examination was performed at a distance of 40 cm. Reading speeds were recorded twice: one for reading the sentence silently (reading only) and one for reading the sentence out loud (reading & speaking).
Results
The test sentences used in the application had 18.9 ± 2.6 letters and 6.5 ± 0.7 words on average. Twenty-five males and seventeen females were included. The average of the reading only speed was 202.3 ± 88.4 words per minute (WPM), and that of the reading & speaking speed was 129.7 ± 25.9 WPM, showing a statistically significant difference (p < 0.001).
References
1. Chia E, Wang JJ, Rochtchina E, et al. Impact of bilateral visual impairment on health-related quality of life: the Blue Mountains Eye Study. Invest Ophthalmol Vis Sci. 2004; 45:71–6.

2. Legge GE, Ross JA, Isenberg LM, LaMay JM. Psychophysics of reading. Clinical predictors of low-vision reading speed. Invest Ophthalmol Vis Sci. 1992; 33:677–87.
3. Legge GE, Ross JA, Luebker A, LaMay JM. Psychophysics of reading. VIII. The Minnesota Low-Vision Reading Test. Optom Vis Sci. 1989; 66:843–53.
4. Radner W, Obermayer W, Richter Mueksch S, et al. The validity and reliability of short German sentences for measuring reading speed. Graefes Arch Clin Exp Ophthalmol. 2002; 240:461–7.
5. Mataftsi A, Bourtoulamaiou A, Haidich AB, et al. Development and validation of the Greek version of the MNREAD acuity chart. Clin Exp Optom. 2013; 96:25–31.
6. Kniestedt C, Stamper RL. Visual acuity and its measurement. Ophthalmol Clin North Am. 2003; 16:155–70. v.
7. Kim JH, Lee JW, Chung JL, et al. Combined implantation of monofocal and multifocal intraocular lenses in senile cataract surgery. J Korean Ophthalmol Soc. 2009; 50:1632–8.
8. Lee KB, Lee HJ, Jun SW, et al. A Study of Correlation among Visual-verbal Skills, Binocular Vision and School Achievement. Korean J Vis Sci. 2008; 10:197–216.
9. Lee SJ, Park JH, Whang KH, Rye GC. The Study on Improvement of Reading Ability for Dyslexia Wearing Color filter lens (ChromaGenTM Lens). J Korean Oph Opt Soc. 2011; 16:65–74.
10. Park SH, Kim SH, Cho YA, Joo CK. The effect of colored filters in patients with Meares-Irlen syndrome. J Korean Ophthalmol Soc. 2012; 53:452–9.
11. Park DG, Lee SJ. A quantitative study on specific syllables used in the colloquial speeches of students. Korean Language Research. 2004; 14:181–99.
12. Park SL. A study on the frequencies of consonants in adult conversational Korean. [Masters's thesis]. Ewha Womans University. 2000; 1–68.
13. Sloan LL, Brown DJ. Reading cards for selection of optical aids for the partially sighted. Am J Ophthalmol. 1963; 55:1187–99.
14. Rubin GS. Visual acuity and contrast sensitivity. Ryan SJ, editor. Retina. 5th ed.St Louis: Mosby;2013. 1:chap. 11.
15. Ishii M, Seki M, Harigai R, et al. Reading performance in patients with glaucoma evaluated using the MNREAD charts. Jpn J Ophthalmol. 2013; 57:471–4.
16. Ergun E, Maár N, Radner W, et al. Scotoma size and reading speed in patients with subfoveal occult choroidal neovascularization in age-related macular degeneration. Ophthalmology. 2003; 110:65–9.
Figure 1.
Comparison of the studies. Frequency of graphemic elements used in the sentences which were composed of syllable blocks.11,12
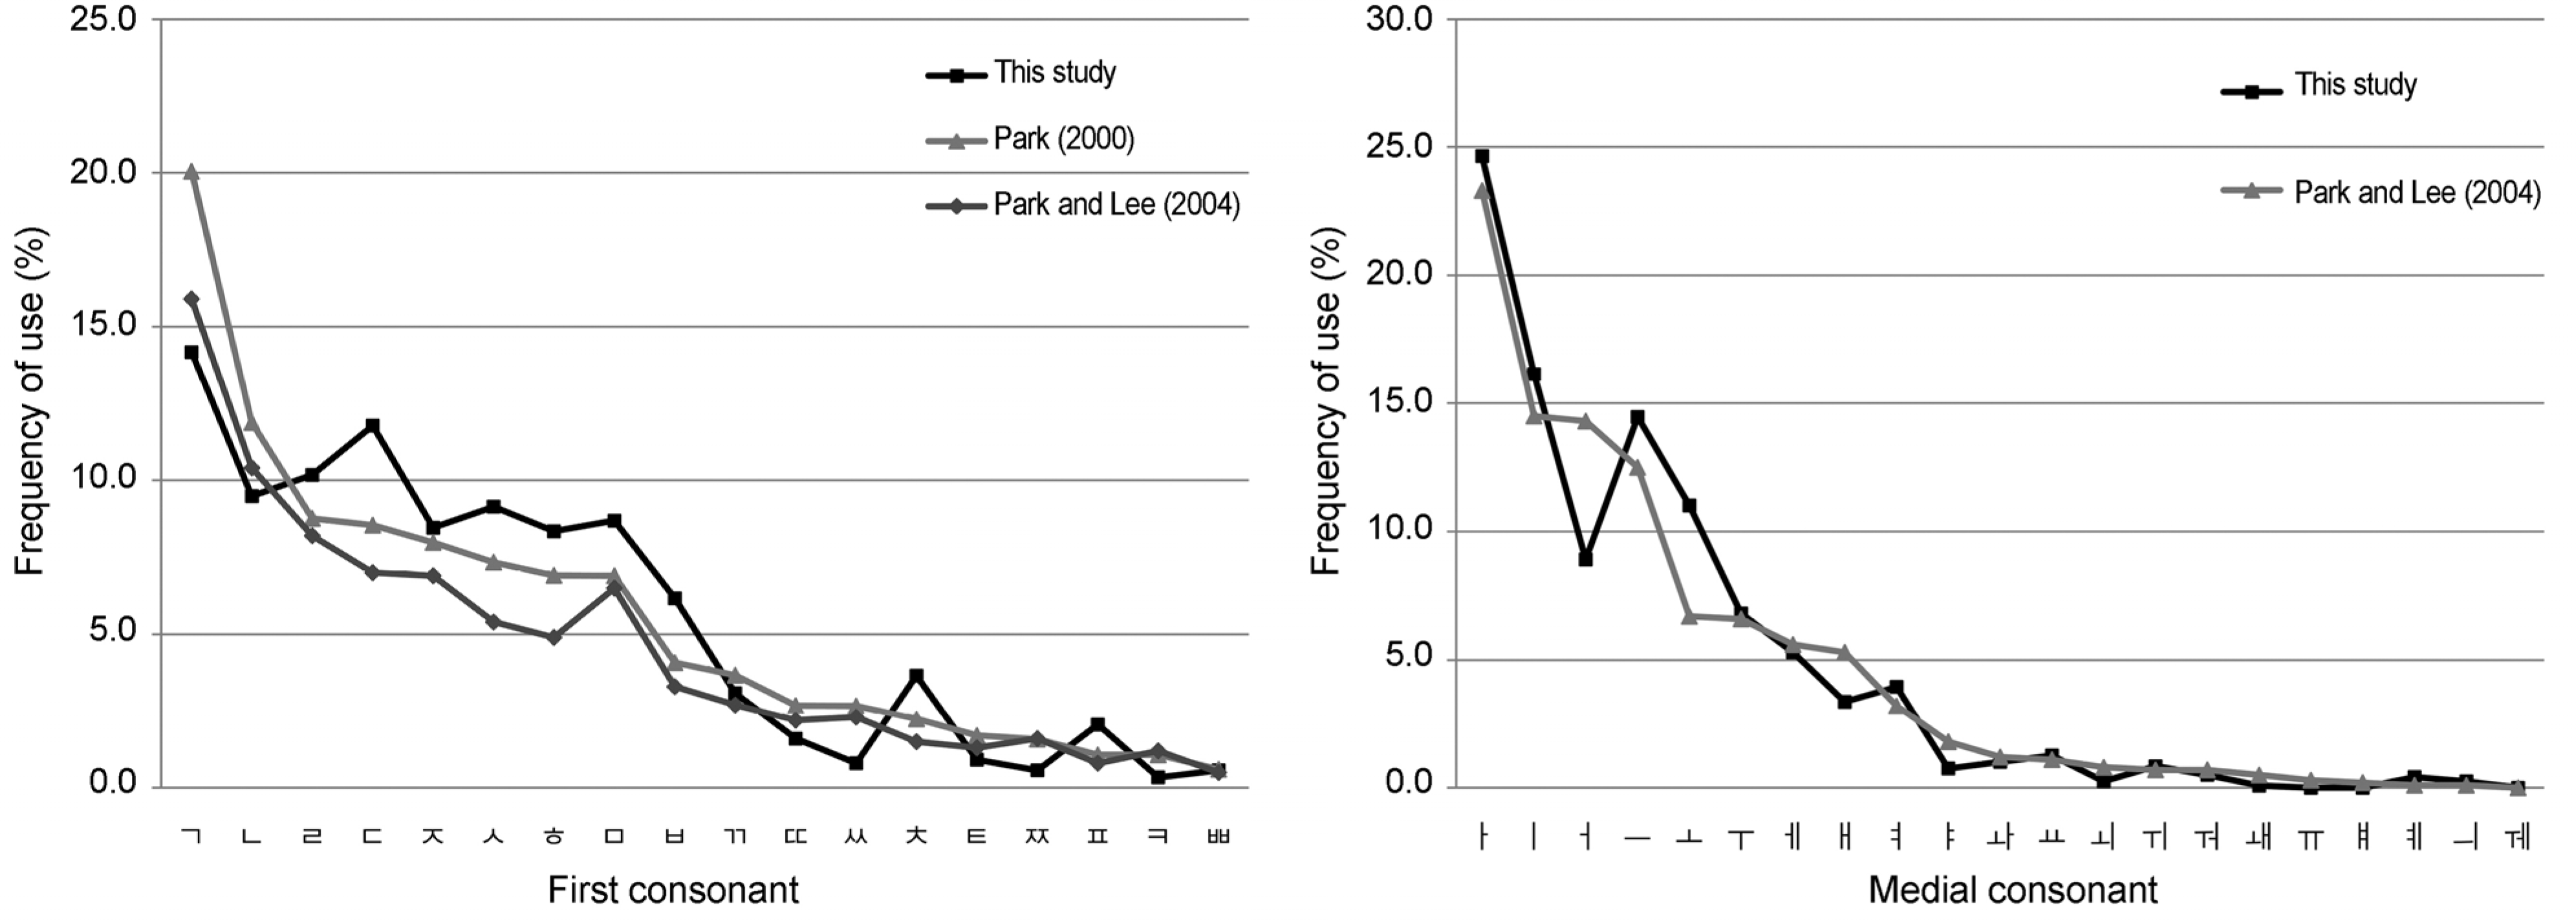
Figure 2.
Test Methods. Comparison of two reading speeds (reading only vs. reading & speaking) in each print size. The average of the reading only speed in each print size was faster than that of the reading & speaking speed (Mann-Whitney U test, p-value< 0.05).
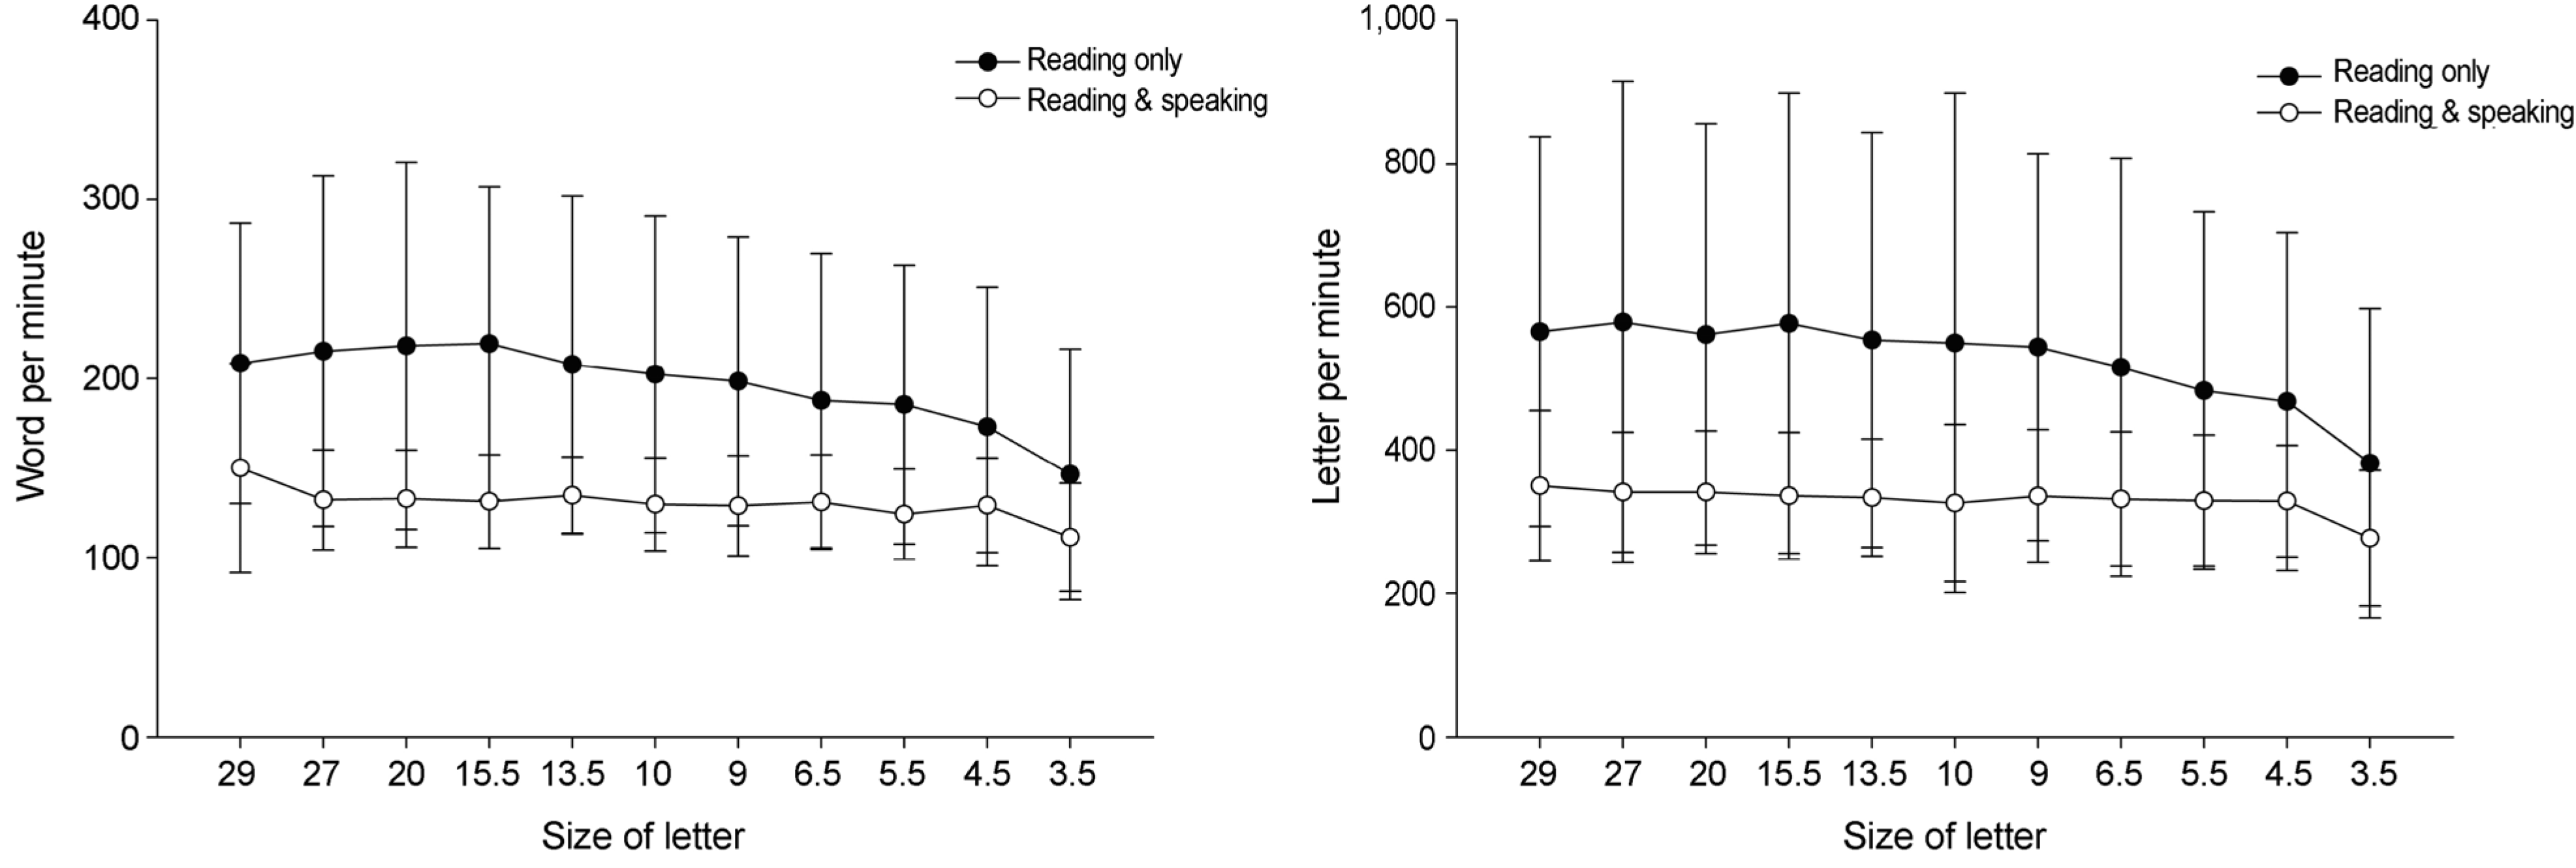
Table 1.
Demographic characteristics
| Male (n = 25) | Female (n = 17) | p-value* | |
|---|---|---|---|
| Age (years) | 29.8 ± 3.6 | 30.4 ± 5.7 | 0.77 |
| CDVA (OD, diopter) | 0.00 ± 0.02 | 0.00 ± 0.02 | >0.99 |
| CDVA (OS, diopter) | 0.00 ± 0.02 | 0.00 ± 0.02 | >0.99 |
| SE (OD, diopter) | −3.06 ± 2.73 | −0.94 ± 2.28 | <0.01 |
| SE (OS, diopter) | −2.97 ± 2.84 | −1.08 ± 2.10 | 0.01 |
| Astigmatism (OD, diopter) | −0.68 ± 0.79 | −0.35 ± 0.39 | 0.27 |
| Astigmatism (OS, diopter) | −0.64 ± 0.70 | −0.54 ± 0.67 | 0.74 |
Table 2.
Graphemic elements used in the sentences which were composed of syllable blocks
Table 3.
Comparison of reading speed (reading only)
| Size of letter (point) | Total (n = 42) | Male (n = 25) | Female (n = 17) | p-value* | |
|---|---|---|---|---|---|
| WPM | 29 | 208.5 ± 78.4 | 207.0 ± 74.7 | 210.6 ± 85.8 | 0.91 |
| 27 | 215.2 ± 97.9 | 231.2 ± 110.4 | 191.7 ± 72.7 | 0.25 | |
| 20 | 218.3 ± 102.6 | 225.6 ± 116.1 | 207.5 ± 81.1 | 0.62 | |
| 15.5 | 219.6 ± 87.5 | 226.8 ± 90.9 | 208.9 ± 83.8 | 0.47 | |
| 13.5 | 207.7 ± 94.2 | 215.7 ± 103.1 | 196.1 ± 80.8 | 0.83 | |
| 10 | 202.3 ± 88.4 | 205.7 ± 100.1 | 197.3 ± 70.5 | 0.84 | |
| 9 | 198.4 ± 80.7 | 205.0 ± 80.7 | 188.8 ± 82.3 | 0.48 | |
| 6.5 | 187.6 ± 82.3 | 203.8 ± 88.9 | 163.9 ± 66.9 | 0.08 | |
| 5.5 | 185.4 ± 78.0 | 193.7 ± 86.9 | 173.2 ± 63.4 | 0.43 | |
| 4.5 | 173.0 ± 77.8 | 185.9 ± 83.3 | 154.1 ± 66.9 | 0.30 | |
| 3.5 | 146.5 ± 70.1 | 155.3 ± 74.8 | 133.4 ± 62.3 | 0.30 | |
| LPM | 29 | 565.6 ± 272.3 | 586.6 ± 233.7 | 534.7 ± 326.0 | 0.43 |
| 27 | 578.8 ± 336.1 | 634.9 ± 371.9 | 496.4 ± 264.4 | 0.34 | |
| 20 | 561.6 ± 294.2 | 594.6 ± 281.1 | 513.1 ± 314.8 | 0.30 | |
| 15.5 | 577.0 ± 321.4 | 641.0 ± 342.7 | 483.0 ± 269.6 | 0.15 | |
| 13.5 | 553.9 ± 289.8 | 605.6 ± 309.5 | 477.9 ± 247.5 | 0.13 | |
| 10 | 549.7 ± 348.9 | 592.2 ± 399.6 | 487.2 ± 256.0 | 0.40 | |
| 9 | 543.9 ± 270.4 | 589.7 ± 263.8 | 476.7 ± 273.6 | 0.17 | |
| 6.5 | 515.6 ± 292.3 | 573.4 ± 310.8 | 430.6 ± 247.2 | 0.08 | |
| 5.5 | 483.1 ± 249.9 | 532.2 ± 260.1 | 410.8 ± 221.7 | 0.13 | |
| 4.5 | 467.7 ± 236.5 | 520.4 ± 236.3 | 390.2 ± 221.0 | 0.08 | |
| 3.5 | 381.6 ± 216.2 | 436.7 ± 222.8 | 300.7 ± 183.2 | 0.03 |
Table 4.
Comparison of reading speed (reading & speaking)
| Size of letter (point) | Total (n = 42) | Male (n = 25) | Female (n = 17) | p-value* | |
|---|---|---|---|---|---|
| WPM | 29 | 150.0 ± 58.5 | 151.2 ± 70.0 | 148.1 ± 37.7 | 0.60 |
| 27 | 132.1 ± 27.9 | 129.9 ± 30.1 | 135.4 ± 24.8 | 0.30 | |
| 20 | 132.9 ± 27.1 | 128.6 ± 24.1 | 139.0 ± 30.6 | 0.34 | |
| 15.5 | 131.2 ± 26.1 | 129.4 ± 28.7 | 133.9 ± 22.4 | 0.60 | |
| 13.5 | 134.6 ± 21.5 | 129.7 ± 19.7 | 141.8 ± 22.6 | 0.08 | |
| 10 | 129.7 ± 25.9 | 129.8 ± 28.8 | 129.5 ± 21.9 | 0.75 | |
| 9 | 128.9 ± 28.0 | 127.2 ± 25.5 | 131.3 ± 31.9 | 0.65 | |
| 6.5 | 130.9 ± 26.4 | 129.9 ± 30.2 | 132.5 ± 20.4 | 0.60 | |
| 5.5 | 124.1 ± 25.2 | 123.4 ± 26.6 | 125.2 ± 23.8 | 0.93 | |
| 4.5 | 129.1 ± 26.4 | 127.5 ±28.6 | 131.6 ± 23.3 | 0.56 | |
| 3.5 | 111.3 ± 30.3 | 110.6 ± 28.8 | 112.3 ± 33.2 | 0.89 | |
| LPM | 29 | 350.1 ± 105.0 | 350.5 ± 91.8 | 349.5 ± 124.9 | 0.78 |
| 27 | 341.0 ± 83.8 | 360.0 ± 90.2 | 312.9 ± 66.3 | 0.04 | |
| 20 | 341.0 ± 85.5 | 342.8 ± 92.3 | 338.3 ± 77.1 | 0.56 | |
| 15.5 | 336.2 ± 88.5 | 342.9 ± 61.3 | 326.2 ± 119.4 | 0.12 | |
| 13.5 | 333.5 ± 81.7 | 331.1 ± 84.2 | 337.1 ± 80.4 | 0.79 | |
| 10 | 325.9 ± 109.8 | 329.7 ± 112.5 | 320.4 ± 108.8 | 0.52 | |
| 9 | 335.6 ± 93.0 | 331.3 ± 95.8 | 342.0 ± 91.3 | 0.99 | |
| 6.5 | 331.5 ± 94.1 | 343.8 ± 94.0 | 313.3 ± 94.0 | 0.19 | |
| 5.5 | 329.2 ± 91.7 | 337.5 ± 92.9 | 317.0 ± 91.3 | 0.62 | |
| 4.5 | 328.7 ± 77.9 | 325.2 ± 76.0 | 333.8 ± 82.8 | 0.75 | |
| 3.5 | 276.9 ± 94.7 | 298.5 ± 97.4 | 245.1 ± 83.2 | 0.05 |
 XML Download