

 PDF
PDF ePub
ePub Citation
 Print
Print


Abstract
Purpose
To evaluate the inter- and intra-observer variability of ocular response analyzer (ORA) measurements, and to evaluate the relationships among the intraocular pressures (IOPs) obtained by ORA, Goldmann applanation tonometer (GAT) and non-contact tonometer (NCT).
Methods
The present study included 45 normal eyes from 45 volunteers. Three masked observers performed ORA measurements. NCT and GAT measurements were performed by one independent observer. The reproducibility of ORA was assessed by ANOVA-based intraclass correlation coefficient (ICC) and coefficient of variation (CV). Comparison among the tonometers was performed using the Bland-Altman plot and paired t-test.
Results
The ICC for inter-observer reproducibility of ORA parameters was 0.90 to 0.97. The corresponding CV values were 13.2% to 19.1%. The intra-observer ICC values for IOP cc were 0.78 to 0.88. CV was 11.2% to 16.8%. For CRF, ICC values were 0.80 to 0.84 with CV values as 11.6% to 15.9%. For CH, ICC values were 0.74 to 0.82 and CV values were 13.0% to 15.9%. The difference in mean IOP values between IOP cc and IOP g was statistically significant (p = 0.04). However, no difference was found among other tonometers, and only IOP cc did not result in significant correlation with central corneal thickness (CCT) (p = 0.38).
Figures and Tables
Figure 1
Measurement of corneal hysteresis. During an ORA measurement, air pulse causes the cornea to move inward. After cessation of air pulse, outward movement occurs and this makes two signal peaks. The difference between these inward and outward applanation pressure is called corneal hysteresis (CH).
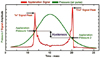
Figure 2
Bland-Altman plots of agreement between IOP g and GAT-IOP, and IOP cc and GAT-IOP. The difference between the measurements is plotted against the average of the measurements. Dotted lines represent 95% limit of agreement. The differences in mean IOP values between IOP g and GAT-IOP (0.31 mm Hg), between IOP cc and GAT-IOP (-0.07 mm Hg) were not statistically significant.
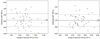
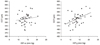
Figure 3
Statistical correlations between IOP g, IOP cc and CCT. CCT was significantly associated with IOP g (r = 0.45, p = 0.002), but not with IOP cc (r = 0.14, p = 0.38). CCT was also correlated with GAT-IOP (r = 0.50, p < 0.001), NCT-IOP (r = 0.57, p < 0.001), CH (r = 0.44, p = 0.002) and CRF (r = 0.46, p = 0.002).

References
1. Gordon MO, Beiser JA, Brandt JD, et al. The Ocular Hypertension Treatment Study: baseline factors that predict the onset of primary open-angle glaucoma. Arch Ophthalmol. 2002. 120:714–720. discussion 829-30.
2. Coleman AL, Miglior S. Risk factors for glaucoma onset and progression. Surv Ophthalmol. 2008. 53:Suppl1. S3–S10.
3. Kass MA, Heuer DK, Higginbotham EJ, et al. The Ocular Hypertension Treatment Study: a randomized trial determines that topical ocular hypotensive medication delays or prevents the onset of primary open-angle glaucoma. Arch Ophthalmol. 2002. 120:701–713. discussion 829-30.
4. Leske MC, Heijl A, Hussein M, et al. Factors for glaucoma progression and the effect of treatment: the early manifest glaucoma trial. Arch Ophthalmol. 2003. 121:48–56.
5. Whitacre MM, Stein R. Sources of error with use of Goldmann-type tonometers. Surv Ophthalmol. 1993. 38:1–30.
6. Liu J, Roberts CJ. Influence of corneal biomechanical properties on intraocular pressure measurement: quantitative analysis. J Cataract Refract Surg. 2005. 31:146–155.
7. Francis BA, Hsieh A, Lai MY, et al. Effects of corneal thickness, corneal curvature, and intraocular pressure level on Goldmann applanation tonometry and dynamic contour tonometry. Ophthalmology. 2007. 114:20–26.
8. Kohlhaas M, Spoerl E, Boehm AG, Pollack K. A correction formula for the real intraocular pressure after LASIK for the correction of myopic astigmatism. J Refract Surg. 2006. 22:263–267.
9. Silva TG, Polido JG, Pinheiro MV, et al. [Application of corrective formula for intraocular pressure changes in patients that underwent LASIK]. Arq Bras Oftalmol. 2011. 74:102–105.
10. Goldich Y, Barkana Y, Avni I, Zadok D. Goldmann applanation tonometry versus ocular response analyzer for intraocular pressure measurements in keratoconic eyes. Cornea. 2010. 29:1011–1015.
11. Kucumen RB, Yenerel NM, Gorgun E, et al. Corneal biomechanical properties and intraocular pressure changes after phacoemulsification and intraocular lens implantation. J Cataract Refract Surg. 2008. 34:2096–2098.
12. Chang PY, Chang SW, Wang JY. Assessment of corneal biomechanical properties and intraocular pressure with the Ocular Response Analyzer in childhood myopia. Br J Ophthalmol. 2010. 94:877–881.
13. Landis JR, Koch GG. The measurement of observer agreement for categorical data. Biometrics. 1977. 33:159–174.
14. Wasielica-Poslednik J, Berisha F, Aliyeva S, et al. Reproducibility of ocular response analyzer measurements and their correlation with central corneal thickness. Graefes Arch Clin Exp Ophthalmol. 2010. 248:1617–1622.
15. Kim SW, Seo SG, Her J, Park SJ. Factors affecting the ocular response analyzer parameters in normal Korean. J Korean Ophthalmol Soc. 2009. 50:1605–1610.
16. Ogbuehi KC, Almubrad TM. Evaluation of the intraocular pressure measured with the ocular response analyzer. Curr Eye Res. 2010. 35:587–596.
17. Pepose JS, Feigenbaum SK, Qazi MA, et al. Changes in corneal biomechanics and intraocular pressure following LASIK using static, dynamic, and noncontact tonometry. Am J Ophthalmol. 2007. 143:39–47.
18. Kirwan C, O'Keefe M, Lanigan B. Corneal hysteresis and intraocular pressure measurement in children using the reichert ocular response analyzer. Am J Ophthalmol. 2006. 142:990–992.
19. Martinez-de-la-Casa JM, Garcia-Feijoo J, Fernandez-Vidal A, et al. Ocular response analyzer versus Goldmann applanation tonometry for intraocular pressure measurements. Invest Ophthalmol Vis Sci. 2006. 47:4410–4414.
20. Sullivan-Mee M, Billingsley SC, Patel AD, et al. Ocular Response Analyzer in subjects with and without glaucoma. Optom Vis Sci. 2008. 85:463–470.
21. Medeiros FA, Weinreb RN. Evaluation of the influence of corneal biomechanical properties on intraocular pressure measurements using the ocular response analyzer. J Glaucoma. 2006. 15:364–370.
22. De Moraes CG, Hill V, Tello C, et al. Lower corneal hysteresis is associated with more rapid glaucomatous visual field progression. J Glaucoma. 2012. 21:209–213.
23. Bochmann F, Ang GS, Azuara-Blanco A. Lower corneal hysteresis in glaucoma patients with acquired pit of the optic nerve (APON). Graefes Arch Clin Exp Ophthalmol. 2008. 246:735–738.
24. del Buey MA, Cristóbal JA, Ascaso FJ, et al. Biomechanical properties of the cornea in Fuchs' corneal dystrophy. Invest Ophthalmol Vis Sci. 2009. 50:3199–3202.
 XML Download