Abstract
Purpose
To evaluate the relationship between postoperative optical coherence tomography (OCT) findings and visual acuity in patients who underwent vitrectomy for macular hemorrhage related to the rupture of a retinal artery macroaneurysm.
Methods
A retrospective case review was conducted for patients who underwent vitrectomy for macular hemorrhage caused by a retinal arterial macroaneurysm. The relationship between postoperative OCT findings and visual acuity was analyzed.
Results
This study included 12 patients whose preoperative mean best corrected visual acuity (BCVA) (logMAR) was 1.7±0.8 and whose mean final BCVA was 0.6±0.5. These values were statistically different (p=0.004). Mean foveal thickness by OCT was 437.5±161.5 μ m at the preoperative period and 252.8±84.9 μ m three months postoperative, and this difference was statisti-cally significant (p=0.017). As the foveal thickness decreased after removal of the remnant organized retinal hemorrhage in the postoperative period, BCVA improved at the final follow-up (p=0.048). According to the postoperative OCT, the photoreceptor disruption group presented a lower BCVA than that of the photoreceptor preservation group at the final follow-up (logMAR: 1.4±0.4 vs. 0.3±0.2, p=0.009).
References
1. Asdourian GK, Goldberg MF, Jampol L, Rabb M. Retinal macro-aneurysms. Arch Ophthalmol. 1997; 95:624–8.

2. Nakamura H, Hayakawa K, Sawaguchi S, et al. Visual outcome after vitreous, sub-internal limiting membrane, and/or submacular hemorrhage removal associated with ruptured retinal arterial macroaneurysms. Graefes Arch Clin Exp Ophthalmol. 2008; 246:661–9.

3. Ibanez HE, Williams DF, Thomas MA, et al. Surgical management of submacular hemorrhage. A series of 47 consecutive cases. Arch Ophthalmol. 1995; 113:62–9.
4. Moriarty AP, McAllister IL, Constable IJ. Initial clinical experience with tissue plasminogen activator (tPA) assisted removal of sub-macular haemorrhage. Eye. 1995; 9:582–8.

5. Lim JI, Drews-Botsch C, Sternberg P Jr, et al. Submacular hemorrhage removal. Ophthalmology. 1995; 102:1393–9.

6. Humayun M, Lewis H, Flynn HW Jr, et al. Management of sub-macular hemorrhage associated with retinal arterial macroaneurysms. Am J Ophthalmol. 1998; 126:358–61.

7. Peyman GA, Nelson NC Jr, Alturki W, et al. Tissue plasminogen acti-vating factor assisted removal of subretinal hemorrhage. Ophthalmic Surg. 1991; 22:575–82.

8. Lee HJ, Chung MR, Kim HC. Treatment of retinal arterial macro-aneurysm. J Korean Ophthalmol Soc. 2003; 44:2250–8.
9. Sakamoto A, Nishijima K, Kita M, et al. Association between fo-veal photoreceptor status and visual acuity after resolution of diabetic macular edema by pars plana vitrectomy. Graefes Arch Clin Exp Ophthalmol. 2009; 247:1325–30.

10. Chang LK, Koizumi H, Spaide RF. Disruption of the photoreceptor inner segment-outer segment junction in eyes with macular holes. Retina. 2008; 28:969–75.

11. Suh MH, Seo JM, Park KH, Yu HG. Associations between macular findings by optical coherence tomography and visual outcomes after epiretinal membrane removal. Am J Ophthalmol. 2009; 147:473–80.

12. Rabb MF, Gagliano DA, Teske MP. Retinal arterial macroaneurysms. Surv Ophthalmol. 1988; 33:73–96.

13. Lavin MJ, Marsh RJ, Peart S, Rehman A. Retinal arterial macro-aneurysms: a retrospective study of 40 patients. Br J Ophthalmol. 1987; 71:817–25.

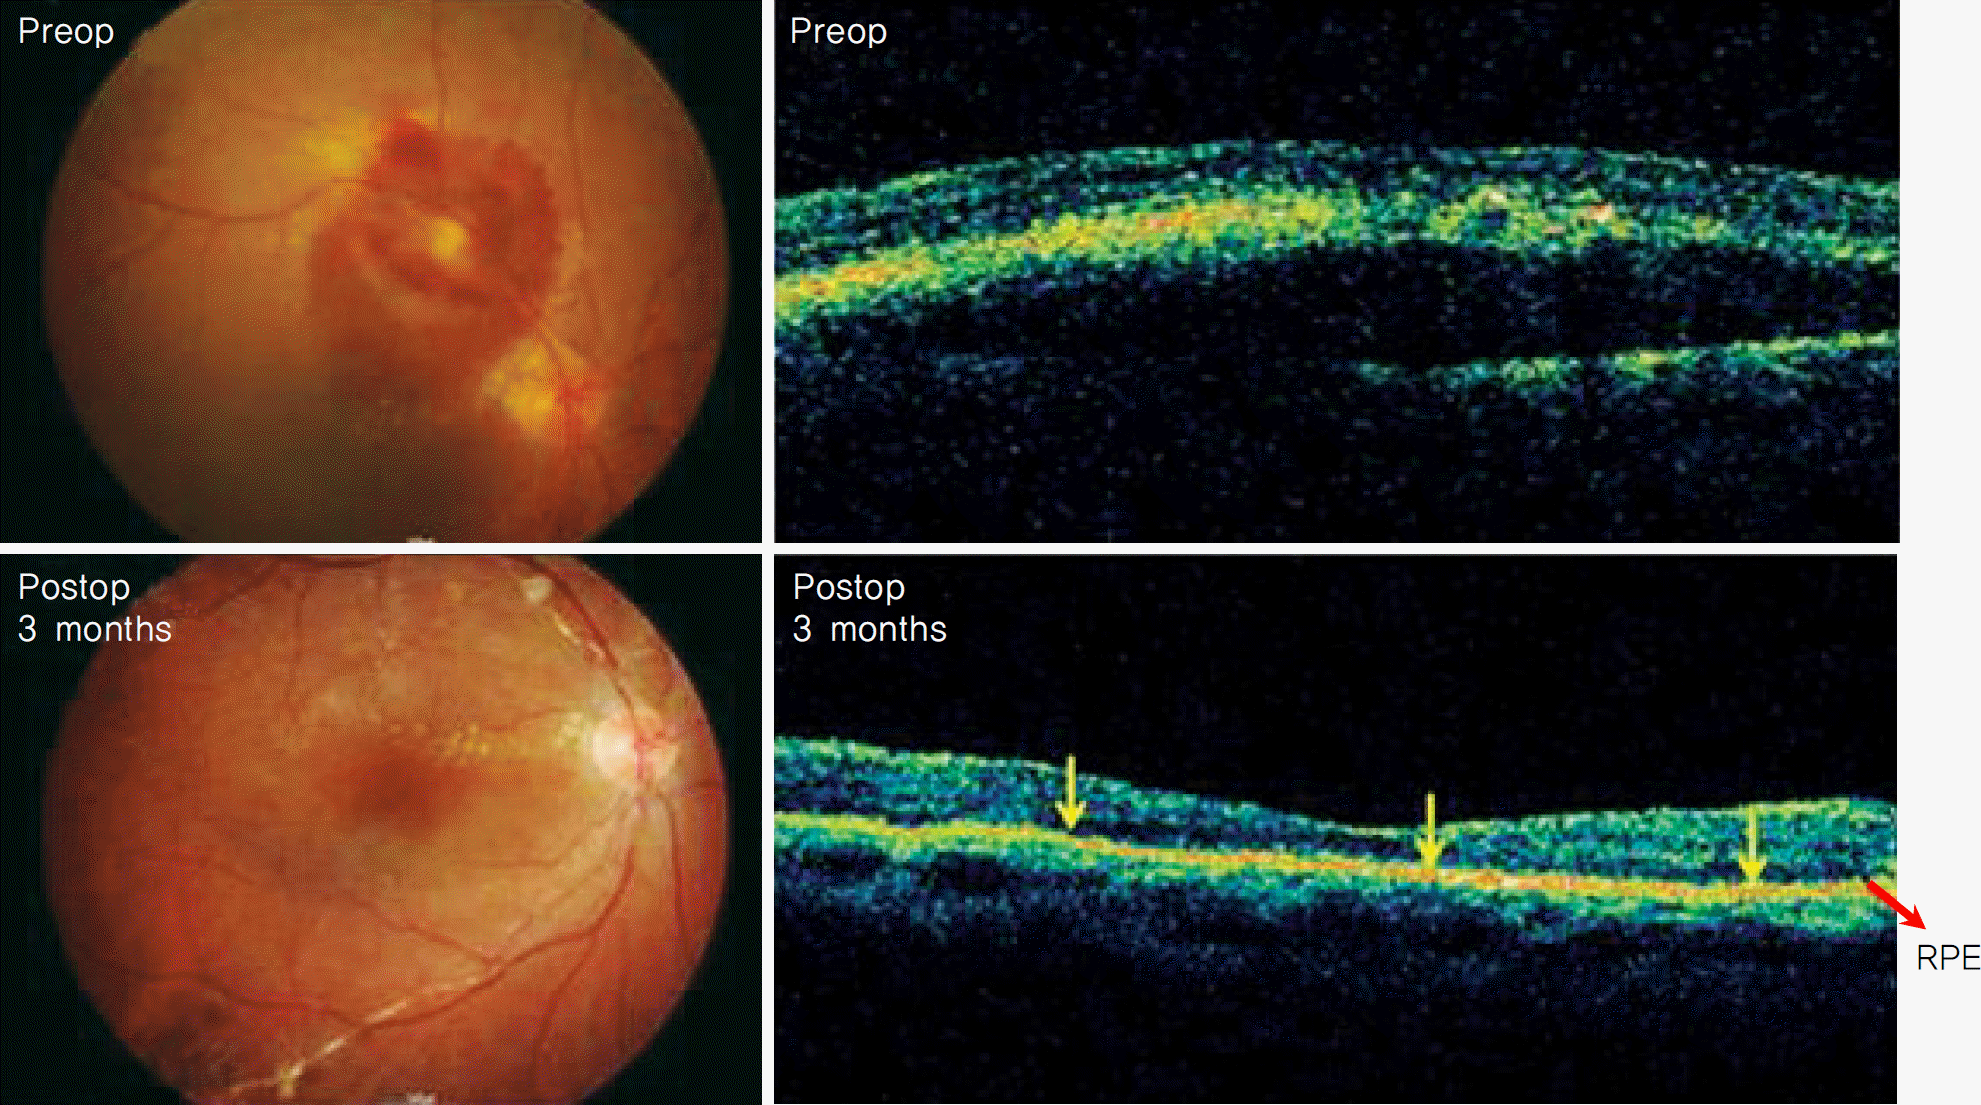
Figure 1.
Optical coherence tomography (OCT) and fundus findings in patient in which postoperative photoreceptor is intact (Yellow arrows: photoreceptor IS-OS junction) (No. 7).

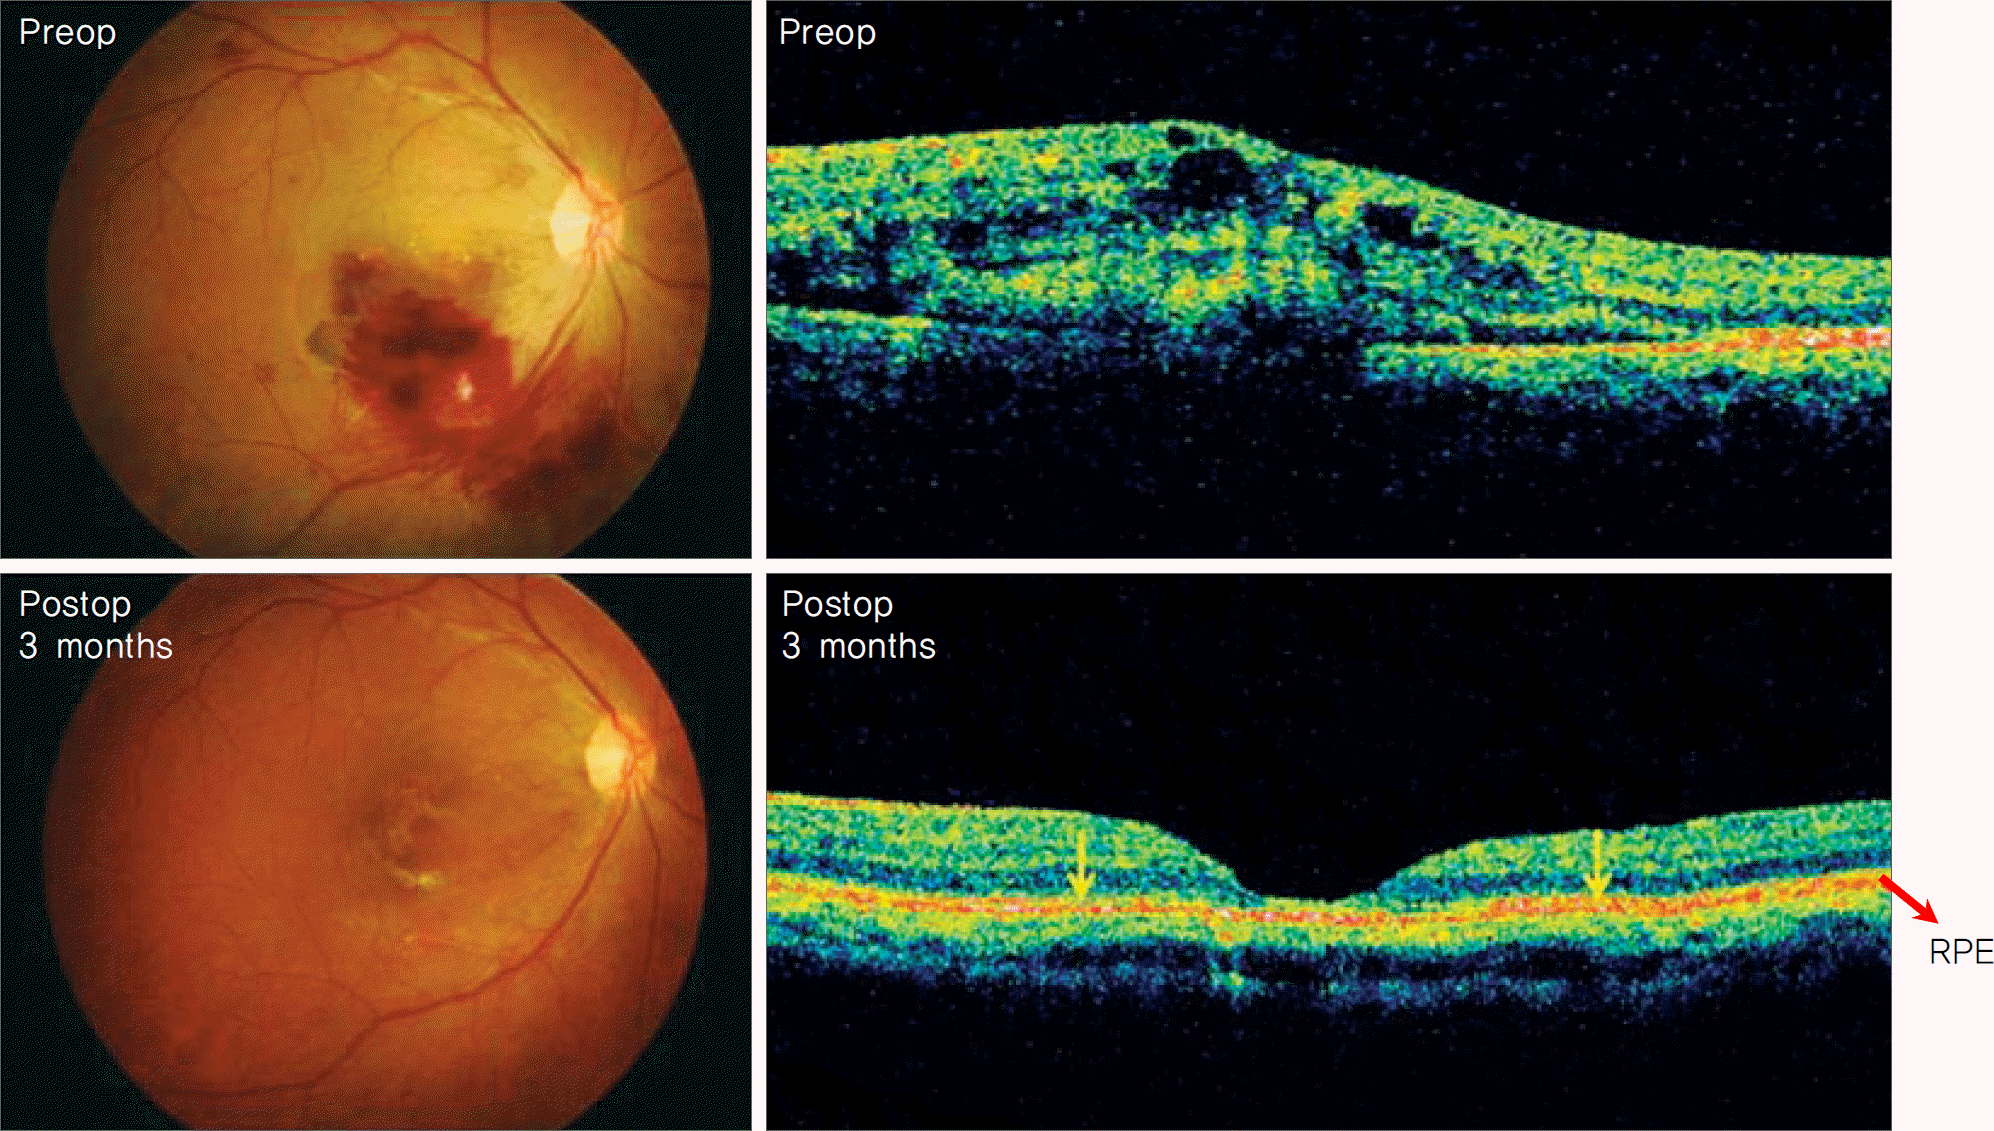
Figure 2.
OCT and fundus findings in patient in which postoperative photoreceptor is disruptive (Yellow arrows: photoreceptor IS-OS junction) (No. 10).

Table 1.
Patient characteristics
Table 2.
Comparison of preoperative and postoperative best corrected visual acuities (BCVA) and foveal thickness
| Preop (n=12) | Postop | P-value* | |
|---|---|---|---|
| BCVA (logMAR) | 1.7±0.8 | 0.6±0.5† | 0.004 |
| Foveal thickness (μm) | 437.5±161.5 | 252.8±84.9‡ | 0.017 |
Table 3.
Comparison of final best corrected visual acuities (BCVA) between intact and disruptive photoreceptor group
| Intact photoreceptor (n=9) | Disruptive photoreceptor (n=3) | P-value | |
|---|---|---|---|
| Final BCVA (logMAR) | 0.3±0.2 | 1.4±0.4 | 0.009* |
Table 4.
Comparison of final best corrected visual acuities (BCVA) between large and small macular hemorrhage group
| Macular Hemorrhage size | Large (≥5 DD) (n=6) | Small (<5 DD)(n=6) | P value |
|---|---|---|---|
| Final BCVA (logMAR) | 0.4±0.6 | 0.9±0.8 | 0.303* |


 PDF
PDF ePub
ePub Citation
 Print
Print


 XML Download