Abstract
Purpose
The study present the central retina arterial supply, optic disc shape, RNFL (retinal nerve fiber layers) thickness and optic disc rim area.
Methods
To evaluate the relationship between central retina artery pattern, optic disk shape, and RNFL thickness was measured using optical coherence tomography (OCT3000) and pattern of the central retinal artery were investigated by TRC50IX. Healthy Koreans (107 males, 97 females) were enrolled in this study. The classification is made by dividing surface of the nerve head into ten sector.
Results
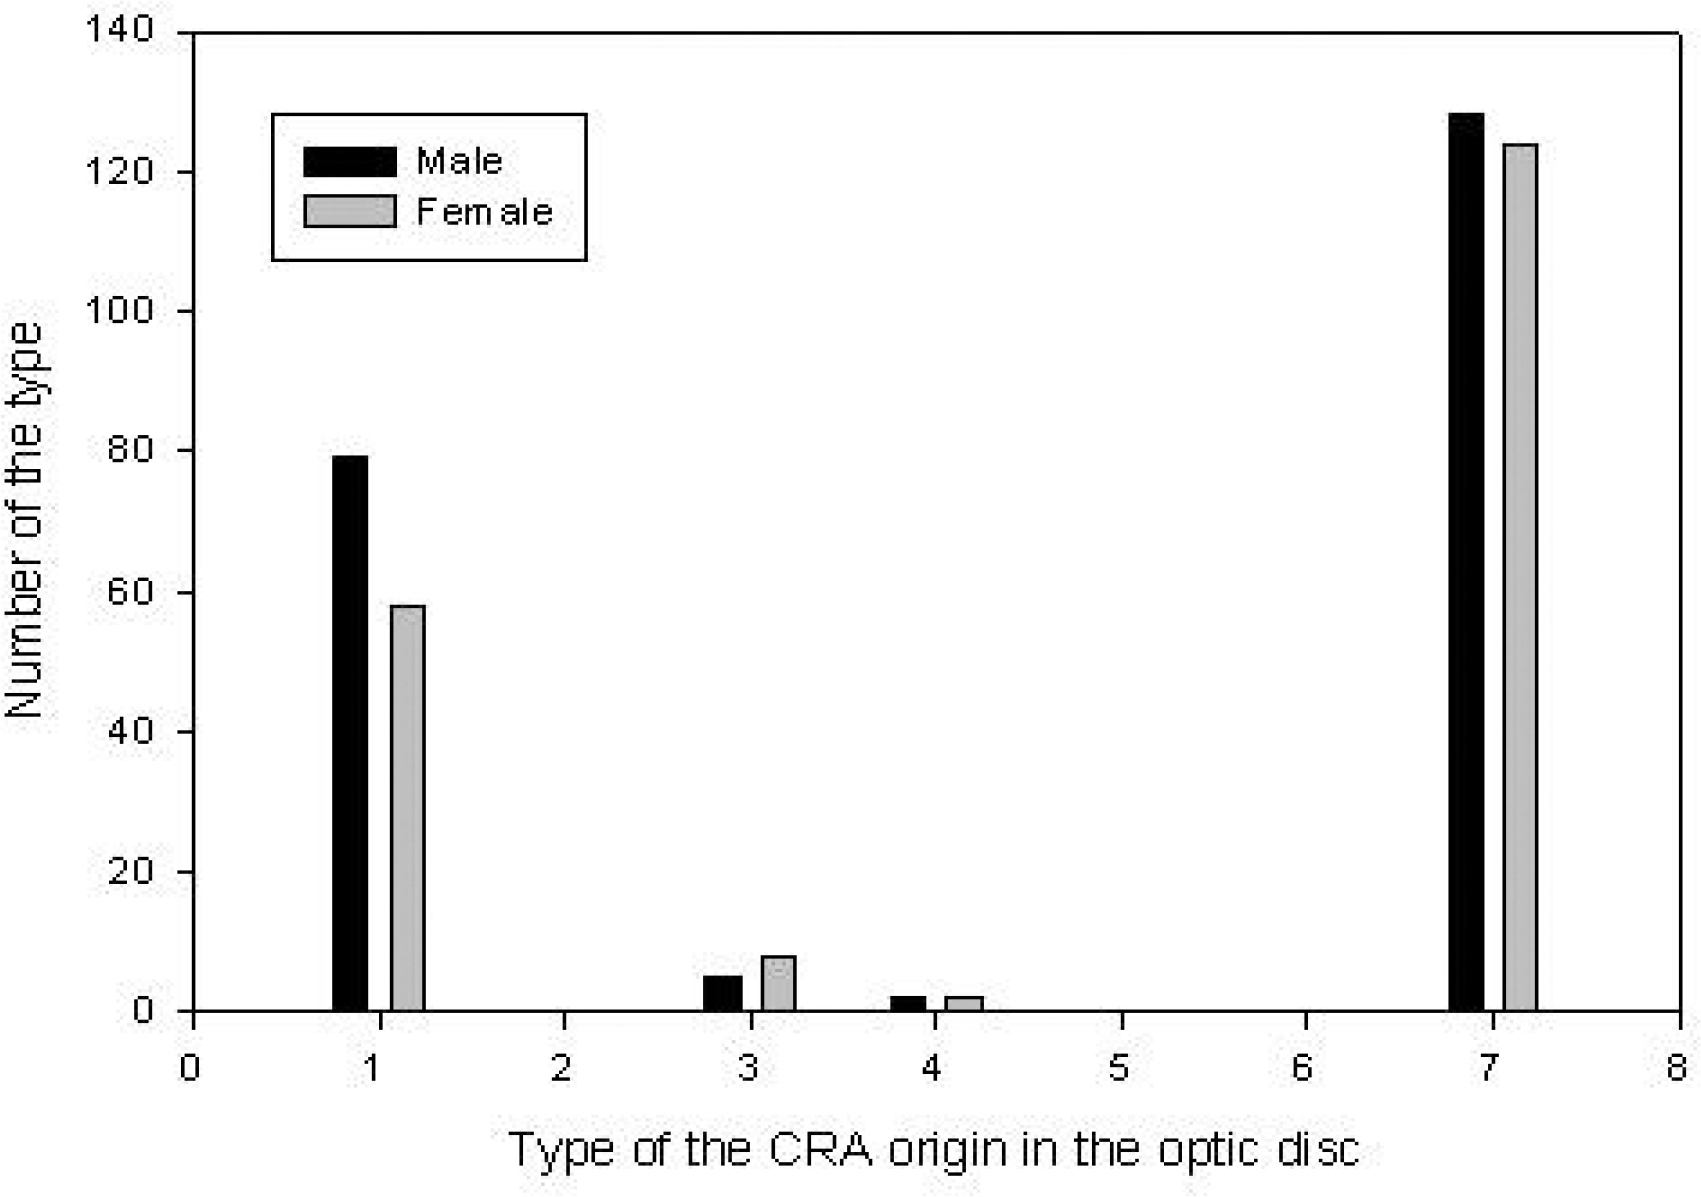
As a result of the shape of the optic disc divided into four group, vertically oval were 54%. The results showed the central retinal artery, in 252 eyes, had its origin in the center. None of the eyes had their origin on temporal side. RNFL thickness according to OCT parameter was superior, 127.68±16.16 ym; temporal quadrants, 79.60±16.05 ym; inferior quadrants.
References
1. Wood EH. The normal optic nerve. Classification of the optic disc based on branching of the central retinal artery. Arch Ophthalmol. 1948; 39:305–12.
3. Syndacker D. The normal optic disc, ophthalmoscopic and photographic studies. Am J Ophthalmol. 1964; 58:958–65.
4. Kim SD, Choi O, Lee JH. Classification of the optic disc. J Korean Ophthalmol Soc. 1976; 17:177–86.
5. Lee SH, Pak BK. On the Ratio to the Physiologic Cupping and Optic Disc. J Korean Ophthalmol Soc. 1971; 12:145–7.
6. Kim JW, Yun DH. C/D Ratio of Korean. J Korean Ophthalmol Soc. 1981; 22:181–91.
8. Chang HR, Choi O. Relationship Between the Optic Disk and Retinal Vessel. J Korean Ophthalmol Soc. 1982; 23:115–25.
9. Quigley Ha, Dunkelberger GR, Green W. Retinal ganglion cell atrophy correlated with automated perimetry in human eyes with glaucoma. Am J Ophthalmol. 1989; 107:453–64.

10. Chauhan DS, Marshall J. The interpretation of optical coherence tomography images of the retina. Invest Ophthalmol Vis Sci. 1999; 40:2332–42.
11. Schuman JS, Tamar PK, Hertzmark E, et al. Reproducibility of nerve fiber layer thickness measurements using optical coherence tomography. Arch Ophthalmol. 1996; 103:1889–98.

12. Poinoosawmy D, Fontana L, Wu JX. Variation of nerve fiber layer thickness measurements with age and ethnicity by scanning laser polarimetry. Br J Ophthalmol. 1997; 81:350–4.
13. Park HJ, Choi JH, Choi KY, Hong C. Relationship between Optic Disc Parameters and Myopic Refractive Errors in Myopia. J Korean Ophthalmol Soc. 1999; 40:1084–9.
14. Quigley HA, Dunkelberger GR, Green WR. Chronic human glaucoma causing selectively greater loss of larger optic nerve fibers. Ophthalmology. 1998; 95:357–63.
15. Kim JM, Park KH, Kim TW, Kim DM. Comparison of the Results between Heidelberg Retina Tomography 2 and Stratus Optical Coherence Tomography in Glaucoma. J Korean Ophthalmol Soc. 2006; 47:556–62.
16. Kestenbaum A. Red shadows on the retina. Klin Monatsblatter Augenheilkd Augenarztl Fortbild. 1954; 125:663–6.
17. Jeong TM, Lee JH, Kim SD, Choi O. Classification of the Optic Disk based on branching of the central retinal artery. J Korean Ophthalmol Soc. 1975; 16:205–8.
18. Jung JH, Kim HW, Kim SD, Choi O. Classification of the Optic Disk Based on Branching of the Central Retinal Artery. J Korean Ophthalmol Soc. 1976; 17:275–9.
19. Ogden TE. Nerve fiber layer of the primate retina: Morphometric analysis. Invest Ophthalmol Vis Sci. 1984; 25:19–29.
20. Sears ML. Clinical and scientific basis for the management of open-angle glaucoma. Arch Ophthalmol. 1986; 104:191–5.
21. Verma R, Bazzaz S, Lai M. Optical tomography-measured retinal nerve fiber layer thickness in normal Latinos. Invest Ophthalmol Vis Sci. 2003; 44:3369–73.
22. Lee JH, Ahn JS, Lee DY. Quantification of Retinal Nerve Fiber Layer Thickness in the Normal Subjects Using Optical Coherence Tomography. J Korean Ophthalmol Soc. 1999; 40:2804–15.
23. Savini G, Zanini M, Carelli V, et al. Ross-Cisneros FN, Barboni P. Correlation between retinal nerve fiber layer thickness and optic nerve head size: an optical coherence tomography. Br J Ophthalmol. 2005; 89:489–92.
24. Schuman JS, Wollstein G, Farra T, et al. Hertzmark E, Ay din A, Fujimoto JG, Paunescu LA. Comparison of optic nerve head measurements obtained by optical coherence tomography and confocal scanning laser ophthalmoscopy. Am J Ophthalmol. 2003; 135:504–12.
25. Tuulonen A, Lehtola J, Airaksinen PJ. Nerve fiber layer defects with normal visual fields. Ophthalmology. 1993; 100:587–98.

26. Ha SW, Rho SH. Age-Related Differences of Optical Coherence Tomography Data in Korean. J Korean Ophthalmol Soc. 2005; 46:2037–44.
27. Medeiros FA, Zangwill LM, Bowd C, et al. Evaluation of retinal nerve fiber layer, Optic nerve head, and macular thickness measurements for glaucoma detection using Optical Coherence Tomography. Am J Ophthalmol. 2005; 139:44–55.

28. Kanamori A, Escano MF, Eno A, et al. Evaluation of the effect of the aging on retinal nerve fiber layer thickness measured by optical coherence tomography. Ophthalmologica. 2003; 217:273–8.
Figure 1.
Normal optic nerve head showing ten types of distribution of the central retinal artery (CRA) origin in the optic disc by Wood's classification. (A) 1. Nasal; 2. Nasal oblique; 3. Temporal oblique; 4. Temporal; 5. Nasal-temporal up; 6. Nasal-temporal down; 7. Temporal-nasal up; 8. Temporal-nasal down; 9. Symmetric; 10. Miscellaneous. (B) Topographic measurement of the central retinal artery (CRA) in the optic disc by fundus camera (TRC50XI).
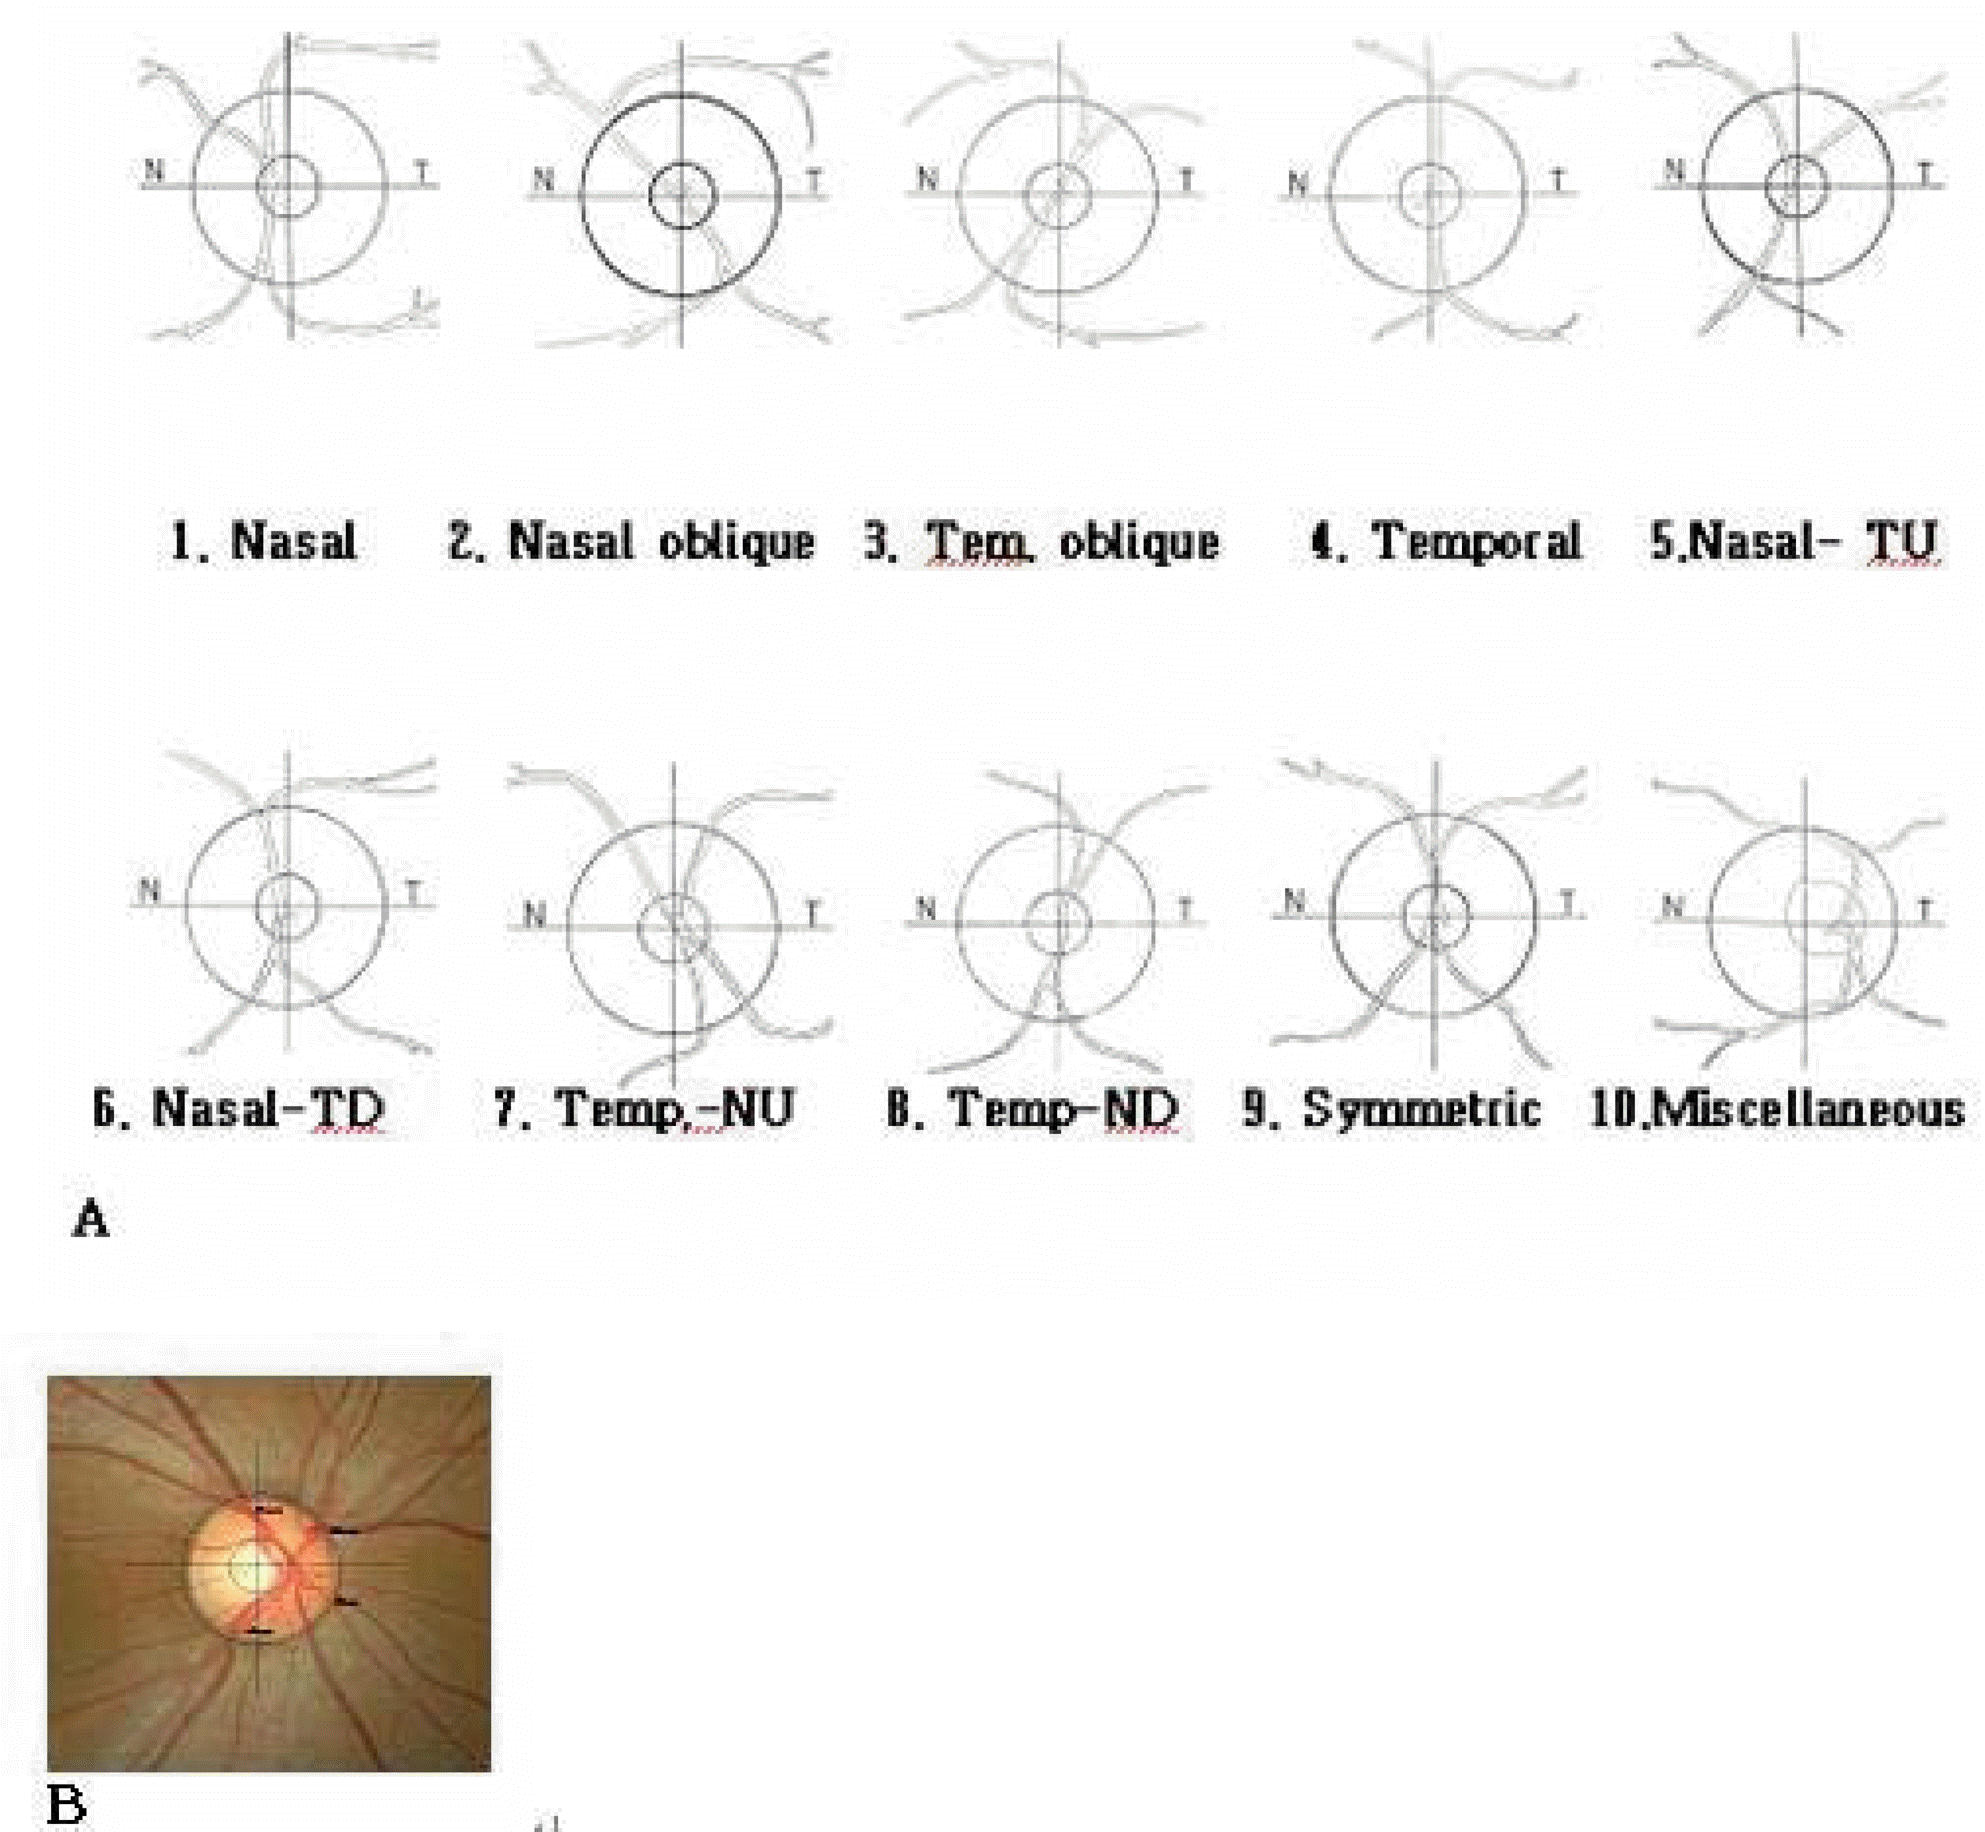
Figure 2.
Distribution of the central retinal artery origin in the optic disc (A) 1. NC : Nasal center; 2. TC : Temporal center; 3. IN : Inferior nasal; 4. SN : Superior nasal; 5. ST : Superior temporal; 6. IT : Inferior nasal; 7. C : Center; (B) Topographic measurement of the central retinal artery in the optic disc by fundus camera (TRC50XI).
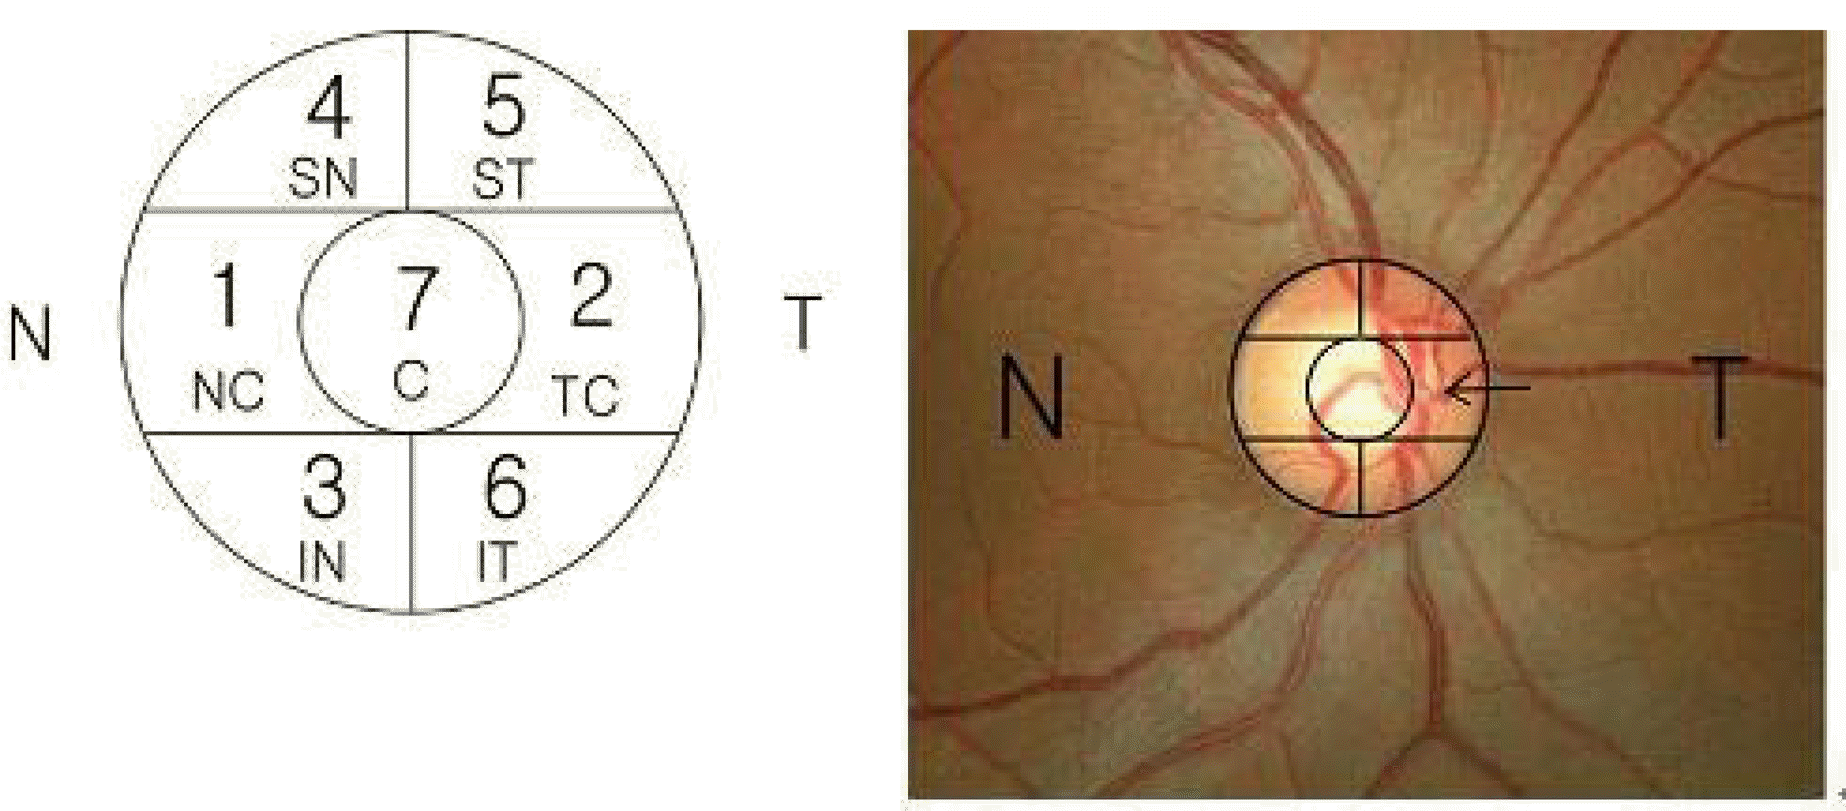
Figure 3.
The distribution of the central retinal artery branches in the optic disc. 1. Nasal; 2. Nasal oblique; 3. Temporal oblique; 4. Temporal; 5. Nasal-temporal up; 6. Nasal- temporal down; 7. Temporal-nasal up; 8. Temporal-nasal down; 9. Symmetric; 10. Miscellaneous.
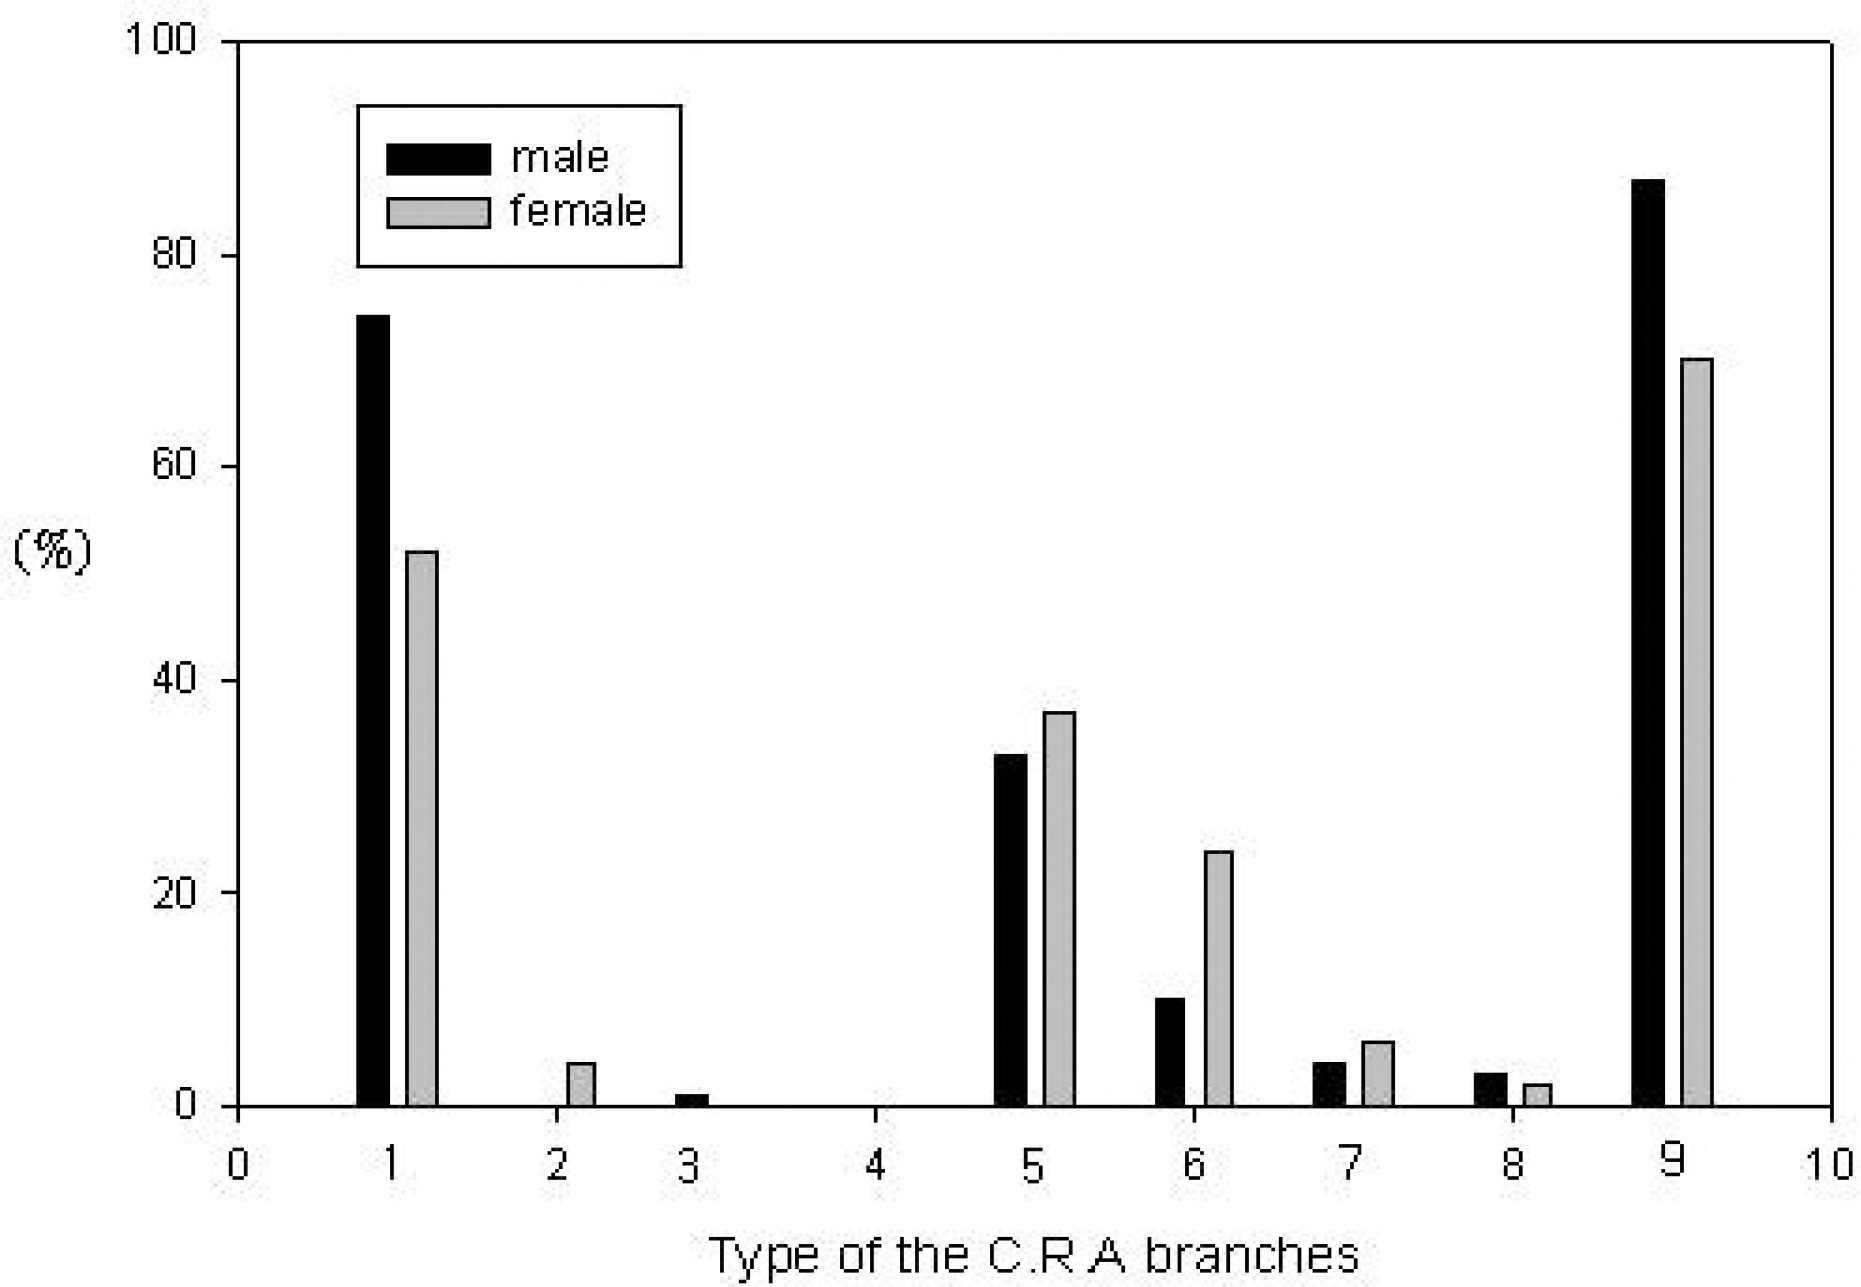
Table 1.
Distribution of normal eyes in each age group
Table 2.
Classification of optic disc types by TRC50IX
Table 3.
Classification of the optic disc by the distribution of arterial branches
Table 4.
Distribution of the CRA origin in the optic disc
| *CRA origin |
20-29 years |
40-49 years |
Total (%) |
|||
|---|---|---|---|---|---|---|
| Male | Female | Male | Female | Male | Female | |
| 1. Nasal-central | 43 | 22 | 36 | 36 | 79 (37) | 58 (29) |
| 2. Temporal-central | 0 | 0 | 0 | 0 | 0 (0) | 0 (0) |
| 3. Nasal down | 3 | 8 | 2 | 0 | 5 (3) | 8 (6) |
| 4. Nasal up | 2 | 2 | 0 | 0 | 2 (1) | 2 (1) |
| 5. Temporal up | 0 | 0 | 0 | 0 | 0 (0) | 0 (0) |
| 6. Temporal down | 0 | 0 | 0 | 0 | 0 (0) | 0 (0) |
|
7. Central |
68 |
54 |
60 |
70 |
128 (59) |
124 (64) |
| Total | 116 | 86 | 98 | 106 | 214 (100) | 196 (100) |
Table 5.
Classification of twigs by the distribution of retinal arterial branches
Table 6.
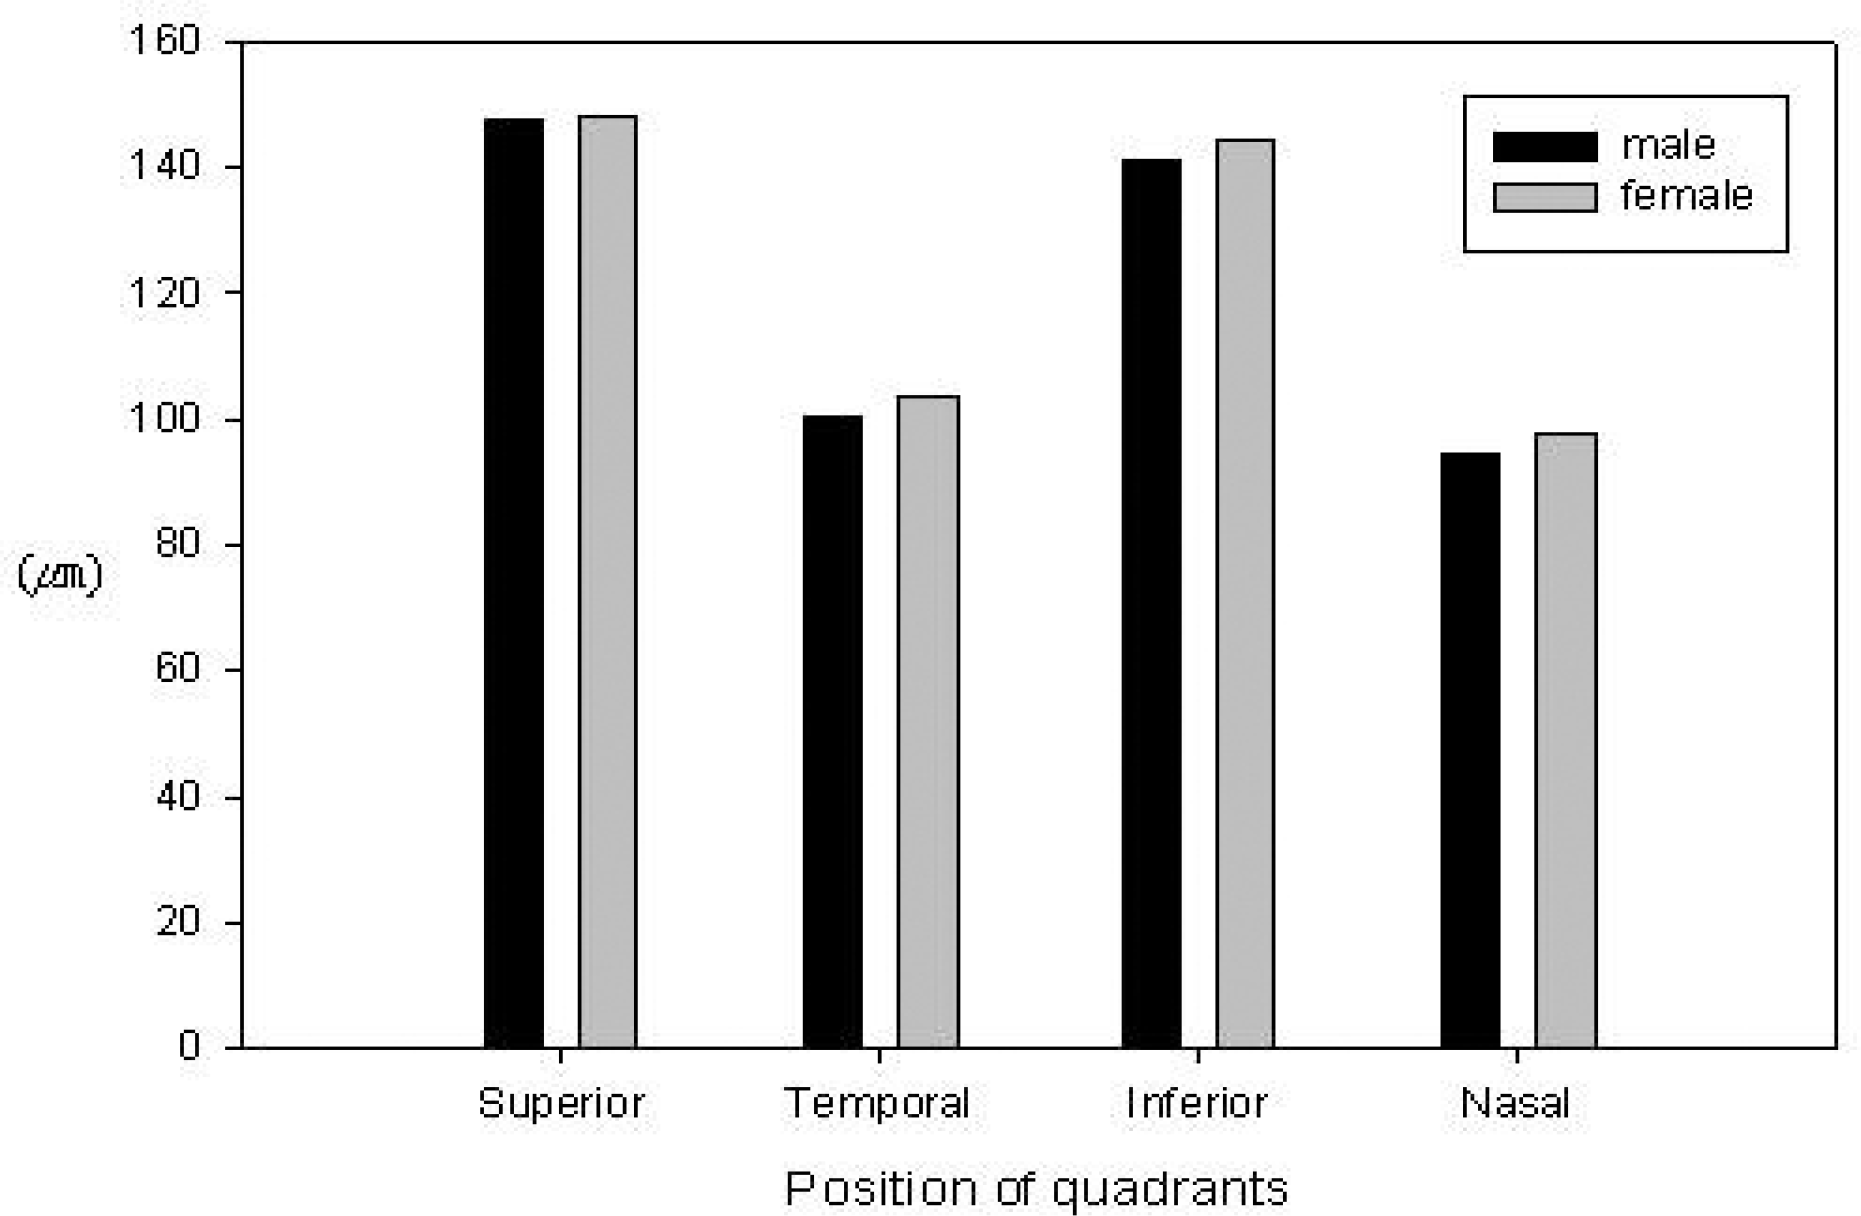
RNFL thickness for all parameter by OCT
|
Measurement *RNFL quadrants |
20-29 years |
40-49 years |
Total |
|||
|---|---|---|---|---|---|---|
| Male | Female | Male | Female | Male | Female | |
| Superior (mean±SD) | 148.93±14.66 | 149.06± 17.95 | 146.14± 15.81 | 147.67±14.50 | 147.66± 15.22 | 148.29±16.09 |
| (min-max) | (121-193) | (100-208) | (123-186) | (120-182) | (121-193) | (100-208) |
| Temporal (mean±SD) | 100.56±13.71 | 107.05± 17.97 | 100.71±12.35 | 100.49± 11.88 | 100.63 ±13.08 | 103.40±15.20 |
| (min-max) | (76-170) | (85-172) | (80-148) | (80-137) | (76-170) | (80-172) |
| Inferior (mean±SD) | 142.241±4.05 | 144.80±13.43 | 139.26±16.25 | 144.56±16.74 | 141.02 ±15.15 | 144.67±15.32 |
| (min-max) | (77-176) | (115-188) | (100-176) | (111-193) | (77-176) | (111-193) |
| Nasal (mean±SD) | 95.34± 13.28 | 98.84±18.34 | 93.91±11.99 | 97.06±14.12 | 94.69 ±12.70 | 97.85±16.11 |
| (min-max) | (68-153) | (58-158) | (71-132) | (65-135) | (68-153) | (58-158) |
Table 7.
RNFL thickness for all parameter by OCT
Table 8.
Relations between AL and RNFL thickness for all parameters
|
20-29 years |
40-49 years |
Total |
||||
|---|---|---|---|---|---|---|
| *AL ≤ 25mm | *AL〉 25mm | ∗AL ≤ 25mm | ∗AL〉 25mm | ∗AL ≤25mm | ∗AL〉 25mm | |
| Superior | 151.75±17.21 | 145.48±13.89 | 146.18± 15.15 | 151.40±14.30 | 148.37±16.20 | 146.97±14,17 |
| (min-max) | (120-208) | (100-176) | (120-186) | (122-178) | (120-208) | (100-178) |
| Temporal | 101.94±15.66 | 105.08±16.23 | 100.32±11.69 | 102.16±14.23 | 100.96±13.39 | 104.35±15.75 |
| (min-max) | (79-172) | (76-172) | (80-137) | (80-137) | (79-172) | (76-172) |
| Inferior | 144.26±15.12 | 142±11.93 | 142.49±17.15 | 139.60±13.62 | 143.19± 16.38 | 142.05±12.40 |
| (min-max) | (77-188) | (119-170) | (100-193) | (111-162) | (77-193) | (111-170) |
| Nasal | 97.45± 14.04 | 96.05±17.62 | 95.66±13.33 | 95.13±12.79 | 96.36±13.62 | 95.82± 16.49 |
| (min-max) | (72-153) | (58-158) | (65-135) | (77-124) | (65-153) | (58-158) |


 PDF
PDF ePub
ePub Citation
 Print
Print


 XML Download