Journal List > Brain Tumor Res Treat > v.4(2) > 1059676

Won, Chung, Kim, Park, Koo, Lee, and Jung: White Matter Change Revealed by Diffusion Tensor Imaging in Gliomas

Abstract

Background

Tumor-related white matter change is detected at late stages with magnetic resonance imaging (MRI), when mass effect or prominent edema is present. We analyzed if diffusion tensor imaging (DTI) white matter change earlier than conventional MRI.

Methods

Twenty-six patients with gliomas (World Health Organization grade II, 5; grade III, 12; and grade IV, 9) within 2 cm from the posterior limb of the internal capsule (IC) were studied. Fifteen normal adults were enrolled as controls. Fluid attenuation inversion recovery MRI showed a high signal change at the posterior limb of the IC (HSIC) in 9 patients with grade III or IV gliomas. We classified the gliomas as WHO grade II (gliomas II), grade III or IV without HSIC [gliomas III/IV(-)] and grade III or IV with HSIC [gliomas III/IV(+)], as an indicator of the increase in the severity of the white matter changes. Fractional anisotropy (FA) and apparent diffusion coefficients (ADC) were calculated for the pyramidal tract. Tumor progression along pyramidal tract was evaluated by follow-up MRI in 16 patients at 40±18 months.

Results

FA showed no significant difference between gliomas II and control (p=0.694), but was lower in gliomas III/IV(-) and gliomas III/IV(+) (p<0.001). ADCs were higher in gliomas II, gliomas III/IV(-) and gliomas III/IV(+) than control (p<0.001). Tumor progression was detected in 2/16 patients.

Conclusion

DTI detected white matter changes that appeared to be normal in MRI. ADC changed even in low grade glioma, indicating ADC may be a better parameter for the early detection of white matter change.

INTRODUCTION

Magnetic resonance imaging (MRI) is commonly used to study brain tumors. Tumor-related white matter change is usually detected at late stage when the mass effect or prominent edema is present [12345]. Because gliomas initially spread along the white matter without causing noticeable changes in routine MRI, tumor extent can be larger than shown by MRI [1234678]. This observation is supported by histopathology [48]. Information about whether the tumor has invaded to white matter tract could have significant implication for the planning of surgical procedures or radiaotherapy. Diffusion tensor imaging (DTI) may detect white matter abnormalities before they are evident by routine MRI, therefore may be useful for the early detection of brain tumors [1235910111213]. The object of this study is to assess change of parameters of DTI for the early detection of tumor-related white matter changes.

MATERIALS AND METHODS

Subjects

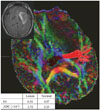
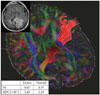
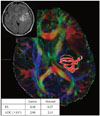
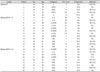
Between 2005 and 2008, 26 patients whose gliomas were within 2 cm from the posterior limb of the internal capsule (IC) were tested. Patients, whose MRI was obtained before steroids medication and before surgery, were selected to reduce the effect of steroid [1415]. The tumor was removed as completely as possible in all patients. Five had World Health Organization (WHO) grade II gliomas, 12 had grade III, and 9 had grade IV. The fluid attenuation inversion recovery (FLAIR) 3.0 T MRI (General Electric VH/i, Milwaukee, WI, USA) showed a high signal change in the IC (HSIC) in 9 patients with grade III or IV gliomas. Patients were reclassified according to the grade of tumor and presence or absence of HSIC:WHO grade II [gliomas II, early stage], grade III or IV without HSIC [gliomas III/IV (-), covert stage] and grade III or IV with HSIC [gliomas III/IV (+), overt stage]. This order is considered to reflect the increase in the severity of the changes caused by the tumor (Table 1, Figs. 1, 2, and 3). After operation, patients were treated with chemotherapy and/or radiotherapy. Tumor progression along pyramidal tract could be evaluated by follow-up MRI in 16 patients at 40±18 months, but follow-up MRIs were not available in the other patients. Fifteen neurologically healthy right-handed normal adults (7 male and 8 female at the age of 33.9±2.6 years) were the control subjects. Informed consent was obtained from all subjects. Handedness was determined using the Edinburg handedness inventory [16]. All subjects scored less than -80 on the Edinburg handedness inventory indicated strong right-handedness. Values of normal subjects were compared with values from patients' groups. This study was approved by the Institutional Review Board at our hospital (H0806-041-243).

Diffusion tensor imaging protocol

DTI was acquired using a 3.0 T MR scanner (General Electric VH/i, Milwaukee, WI, USA) with a conventional head gradient coil. We used a single-shot spin-echo echo planar imaging sequence. The B-factor was set at 1,000 sec/mm2. The acquisition parameters were: field of view=240 mm, matrix=256×256, slice thickness/gap=3.5 mm/0 mm, total slice number=38, repetition time/echo time=10,000 ms/90 ms, and scan average=1. To estimate the intensity and direction of the diffusion anisotropy, MRI with 25 noncollinear diffusion gradients without diffusion gradients were acquired. From 26 diffusion-weighted images, we obtained six diffusion tensor components, namely, Dxx, Dyy, Dzz, Dxy, Dxz, and Dyz, using multiple linear equations. We determined the direction of the fiber tracts from Vmax, i.e., an eigenvector maximum eigenvalues of three eigenvectors obtained by the eigen-decomposition of the diffusion tensor.

Data processing

We performed two data processing procedures. First, the digital images from all subjects were stored as digital imaging and communications in medicine (DICOM) files using the picture archiving and communication system. The DICOM files were converted for analysis using the MRIcro program (version 1.40, University of South Carolina, Columbia, SC, USA, www.mricro.com). Second, tractographic analysis was performed using the DTIstudio (Johns Hopkins University, Baltimore, MD, USA, www.mristudio.org) program. The advanced fast marching tractography algorithm in this program was used to follow the fiber tracts [17]. The tracts were defined to begin where the fractional anisotropy (FA) was greater than 0.1 and traced until they reached voxels with an FA of less than 0.1 or turned at an angle greater than 70 degrees [18].

Tractography

We used the 'two ROIs method' to trace the pyramidal tract [19]. All processing was performed by one image analyzer (CHK) [20]. We located the first region of interest (ROI) at the posterior limb of the IC from a color-coded FA map. The second ROI was located on the cerebral peduncle and those fibers that passed through both ROIs were selected. The FA and apparent diffusion coefficients (ADC) were calculated from each whole pyramidal tract.

Statistical analysis

The Kruskal-Wallis and Mann-Whitney U test were used to compare the two hemispheres and groups. A p-value of less than 0.05 (two-sided) was considered to be statistically significant. All analyses were performed using commercially available software (SPSS version 12.0, SPSS Inc, Chicago, IL, USA). The post hoc analysis was performed using Bonferroni's method.

RESULTS

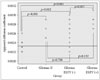
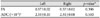
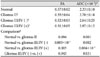
There was no difference in FA or ADC between the two hemispheres in normal subjects (p>0.05, Kruskal-Wallis test) (Table 2). We used left-side values to simplify comparisons. In early stage (gliomas II), FA was the same as control subjects, whereas ADC was higher than control subjects (p=0.694 and 0.001, respectively, Mann-Whitney U test) (Table 3, Figs 1, 4, and 5). FA was lower in the covert stage [gliomas III/IV (-)] and overt stage [gliomas III/IV (+)] (p=0.003×10⁻¹ and 0.003, respectively, Mann-Whitney U test) (Table 3, Figs 2, 3, 4, and 5). ADC was higher in both covert and overt stages than in control subjects (p=0.002 and 0.004×10⁻², respectively, Mann-Whitney U test) (Table 3, Figs. 2, 3, 4, 5). ADC was higher in the presence of HSIC (p=0.031) (Table 3, Fig. 5), whereas there was no difference in FA values (p=0.943) (Table 3, Fig. 4) between gliomas III/IV (-) and gliomas III/IV (+). Horizontal line in Figs. 4, 5 indicated mean FA and ADC values of normal subject (FA=0.57 and ADC=2.33×10⁻³). Among the 16 patients, who underwent MRI follow-up, tumor progression along pyramidal tract was observed in 2 patients; cerebral peduncle in Patient 1, and coronal radiata in Patient 9.

DISCUSSION

Stage of tumor-related white matter change

We attempted to determine whether DTI detects tumor-related white matter changes earlier than routine MRI. We classified the severity of the white matter change as early, covert and overt stages. Although this classification seems arbitrary, we suggest that it reflects the severity of tumor-related change in white matter [123467]. We believe that this is the first study linking white matter structure with the severity of changes caused by gliomas. However, without histological confirmation, our classification just suggested a possible severity of change in white matter caused by the tumor.
It has been reported that in untreated brain glioblastoma, the extent of tumor is well correlated with MRI finding and tumor cell extended to the white matte change [4]. Usually, tumor cell is known to be exist to high signal change in FLAIR MRI and this is corresponded to overt stage [gliomas III/IV (+)] in the present study [4]. We divided high-grade gliomas according to the presence of high signal change in white matter. All selected gliomas were within 2 cm from the IC and may have the potential to infiltrate IC [24212223]. Glioma cell may exist in white matter although there was no high signal change in FLAIR MRI [covert stage, gliomas III/IV (-)].
We evaluate the status of white matter by change of ADC and FA values. The Change of FA value was known to be correlated with tumor cell density [242526]. This result is supported by histological comparison study with DTI [2]. Gliomas III/IV (-) and (+) showed that FA was lowered than control and this may be interpreted as tumor cell infiltration [12391011121326]. There was no difference in FA between Gliomas III/IV (-) and (+) and this may imply that tumor cell may exist even though there was no signal change in FLAIR MRI. The difference between gliomas III/IV (-) and gliomas III/IV (+) was increased ADC values and this may be explained as further edematous change after tumor infiltration [12391011121326]. At an early stage, there was an increase in ADC without change of FA. Even though many report support that FA change is correlated with tumor cell infiltration by histological confirmation, there is limited data about solitary ADC change [13262728]. The detection of tumor infiltration by ADC has been demonstrated in several studies comparing malignant gliomas with other noninfiltrating tumors and ADC change was considered to reflect tumor infiltration [13262728]. However, ADC change is usually interpreted as tumor infiltration when accompanied by FA change [13262728]. Moreover, there is report which showed no change of ADC or FA in low-grade glioma [7]. ADC could be changed in edematous situation and there is also individual variation [28293031]. With small number of patients, differentiation between tumor infiltration, edema and individual variation was not possible. Without histological confirmation, we could not interpret ADC change as tumor infiltration and the term 'tumor-related white matter change' would be reasonable expression.

The follow-up image

We assumed that FA and ADC changes may reflect white matte change and these changes may be correlated with tumor cell infiltration [12391011121326]. However, without histological data of our subjects, these were just assumption and follow-up image was used for interpretation. In the present study, even though change of ADC and FA were prominent, there was no progression of tumor in most cases. Tumor progression was detected only in one patient with Glioma II and one with Glioma III/IV (-). This result may be interpreted as no tumor infiltration in most cases. However, we should think about following factors. First, ADC and FA could be changed in both edematous situation and tumor infiltration [28293031]. Although some authors suggested that DTI may differentiate edematous change from tumor infiltration, this result was not conclusive [22930313233]. Lunsford et al. [34] reported that 'Tumor boundaries extended beyond the computed tomography or MRI margin in 4/4 of glioblastoma, 1/3 of anaplastic astrocytoma and 1/6 of astrocytoma' with stereotactic biopsy. Our case may include both edematous change and tumor infiltration in case of gliomas II or gliomas III/IV (-) [28]. However, even in cases of gliomas III/IV (+), which is regarded as definite tumor infiltration, the progression was not detected. Second explanation is the effect of adjuvant therapy. Most patients underwent adjuvant therapy such as radiotherapy or chemotherapy. This may halt progression of tumor, even though there was tumor infiltration in the pyramidal tract. However, without histological confirmation, these were just assumption.

The threshold of FA

Because tractography only shows a portion of the intact fibers, it may under- or over-estimates fiber status [3335]. A DTI study of gliomas suggested that an FA threshold of 0.15 is reasonable [33]. However, another study used the threshold of 0.12 to detect fibers that were not detected with a threshold of 0.14 [36]. These findings imply that parameter of DTI may change according to threshold of FA. We used the FA threshold of 0.1 to include as many potential fibers passing through IC as possible [33]. Our threshold is somewhat arbitrary in the absence of agreement on the appropriate threshold for detecting all fibers [35]. False positives may result from increasing the sensitivity. Further larger studies with histological verification are required to determine the practical threshold for FA.

Limitations of study

We have demonstrated the possibility of using DTI for the early detection of glioma-related changes in white matter. This might be clinically useful in assessing tumor progression following treatment. However, there are several limitations in this study. First, we examined a relatively small number of patients and there may be inborn individual variation. Second, we did not classified according to age and there may be age effect, although there is one report that showed no change of diffusion anisotropy with age [37]. The most significant drawback in our study is the lack of histological evidence. If this finding was verified with pathologic examination, this might be clinically useful in assessing or predicting tumor progression. Because the link between increased ADC and tumor infiltration was not histologically verified, there is the possibility that the increase in ADC merely reflects vasogenic edema without tumor infiltration [4212228]. At present, discrimination tumor infiltration from vasogenic edema with DTI is not accurate [28]. Finally, we could not verify tumor progression, because observation without adjuvant therapy was impossible. Despite these limitations, our results suggest that DTI (especially ADC) may be an useful tool for the early detection of tumor related white matter change. However, this result is a preliminary one and to apply in clinical practice, a study of a larger number of patients with histological confirmation is required.
In conclusions, DTI detected changes in white matter that appeared to be normal in routine MRI. ADC changed earlier than FA, indicating that ADC may be a better parameter for the early detection of white matter change. However, more cases should followed-up to corroborate clinical significance.

Figures and Tables

Fig. 1

An early stage tumor (gliomas II). The astrocytoma is located in the left insular lobe and compresses the internal capsule (Patient 5). However, there is no HSIC (left upper figure). The pyramidal tract is traced from the posterior limb of the internal capsule. The inserted table shows that ADC is higher than that of normal subject, but FA is similar. ADC, apparent diffusion coefficient; FA, fractional anisotropy; FLAIR, fluid attenuated inversion recovery; HSIC, high signal change at the level of the internal capsule in FLAIR magnetic resonance imaging.

btrt-4-100-g001
Fig. 2

A covert stage tumor [gliomas III/IV (-)]. The glioblastoma is located in the left occipital lobe with surrounding edema (Patient 14), but there was no HSIC (left upper figure). The pyramidal tract is traced from the posterior limb of the internal capsule. The inserted table shows that FA is lower and ADC is higher than in normal subjects. ADC, apparent diffusion coefficient; FA, fractional anisotropy; FLAIR, fluid attenuated inversion recovery; HSIC, high signal change at the level of the internal capsule in FLAIR magnetic resonance imaging.

btrt-4-100-g002
Fig. 3

An overt stage tumor [gliomas III/IV (+)]. The glioblastoma is located in the left parietal lobe with surrounding edema (Patient 23). There was HSIC (left upper figure). The pyramidal tract is traced from the posterior limb of the internal capsule. The inserted table shows that FA is lower and ADC is higher than in normal subjects. ADC, apparent diffusion coefficient; FA, fractional anisotropy; FLAIR, fluid attenuated inversion recovery; HSIC, high signal change at the level of the internal capsule in FLAIR magnetic resonance imaging.

btrt-4-100-g003
Fig. 4

FA values according to stages. FA is decreased from the covert stage (p<0.001). There is no difference associated with the presence of HSIC (glioma III/IV (-) vs. glioma III/IV (+), p=0.943). p-values are marked in the graph after the Mann-Whitney U test. FA, fractional anisotropy; FLAIR, fluid attenuated inversion recovery; HSIC, high signal change at the level of the internal capsule in FLAIR magnetic resonance imaging.

btrt-4-100-g004
Fig. 5

ADC values according to stages. ADC increased from the early stage (p<0.001). ADC is increased if there is HSIC (p=0.031) in glioma III/IV. p-values are marked in the graph after the Mann–Whitney U test. ADC, apparent diffusion coefficient; FLAIR, fluid attenuated inversion recovery; HSIC, high signal change at the level of the internal capsule in FLAIR magnetic resonance imaging.

btrt-4-100-g005
Table 1

Characteristics of the subjects

btrt-4-100-i001
Group Patient Sex Age Diagnosis F/U (mo) Progression Adjuvant
Glioma II* 1 M 28 A 5 Yes RT, CTx
2 M 39 ODG 1 N/A No
3 M 25 ODG 0 N/A RT, CTx
4 F 32 ODG 26 No RT, CTx
5 M 36 A 0 N/A RT
Glioma III/IV (-) 6 F 33 A-A 56 No RT
7 F 27 A-A 38 No RT, CTx
8 M 48 A-ODG 63 No RT, CTx
9 F 52 A-OA 23 Yes RT
10 M 35 A-ODG 31 No RT
11 F 32 A-ODG 23 No RT, CTx
12 M 51 A-OA 55 No RT
13 F 62 A-EPN 5 N/A RT, CTx
14 M 70 GBL 5 N/A No
15 M 41 GBL 1 N/A RT, CTx
16 M 51 GBL 15 No RT, CTx
17 M 67 GBL 0 N/A No
Glioma III/IV (+) 18 M 37 A-ODG 61 No RT, CTx
19 F 43 A-A 57 No RT, CTx
20 F 36 A-OA 55 No CTx
21 F 40 A-EPN 55 No CTx
22 M 42 GBL 22 No RT, CTx
23 F 43 GBL 9 N/A RT, CTx
24 M 50 GBL 0 N/A No
25 F 51 GBL 16 No RT, CTx
26 F 45 GBL 0 N/A No

*WHO grade II gliomas, WHO grade III or IV gliomas without HSIC, WHO grade III or IV gliomas with HSIC. A-, anaplastic; EPN, ependymoma; GBL, glioblastoma; OA, oligoastrocytoma; ODG, oligodendroglioma; FLAIR, fluid attenuated inversion recovery; HSIC, high signal change at internal capsule in FLAIR MR image; N/A, not available; RT, radiotherapy; CTx, chemotherapy; F/U, follow up

Table 2

FA and ADC values in normal subjects

btrt-4-100-i002
Left Right p-value*
FA 0.57±0.02 0.57±0.02 0.396
ADC (×10−3) 2.33±0.10 2.31±0.08 0.510

*Mann-Whitney U test was used, A unit is mm2/second. ADC, apparent diffusion coefficient; FA, fractional anisotropy.

Table 3

FA and ADC values according to stages

btrt-4-100-i003
FA ADC (×10–3)*
Normal 0.57±0.02 2.33±0.10
Gliomas II 0.55±0.04 2.78±0.18
Gliomas III/IV (−) 0.52±0.03 2.64±0.25
Gliomas III/IV (+) 0.51±0.05 2.87±0.12
Comparison
 Normal vs. gliomas II 0.694 0.001
 Normal vs. gliomas III/IV (−) 0.003×10⁻¹ 0.002
 Normal vs. gliomas III/IV (+) 0.003 0.004×10⁻²
 Gliomas III/IV (−) vs. (+) 0.943 0.031

*The unit is mm2/second, Gliomas are grouped as WHO grade II [gliomas II, early stage], grade III or IV without HSIC [gliomas III/IV (-), covert stage] and grade III or IV with HSIC [gliomas III/IV (+), overt stage], This classification reflects the stage of tumor-related white matter change, in order of increasing severity, Mann-Whitney U test is used for comparison between groups. ADC, apparent diffusion coefficient; FA, fractional anisotropy; FLAIR, fluid attenuated inversion recovery; HSIC, high signal change at internal capsule in FLAIR MR image.

Acknowledgments

This work was supported by the National Research Foundation of Korea (NRF) grant funded by the Korea government (MSIP) (No. 2010-0028631).

Notes

Conflicts of Interest The authors have no financial conflicts of interest.

References

1. Price SJ, Jena R, Burnet NG, Carpenter TA, Pickard JD, Gillard JH. Predicting patterns of glioma recurrence using diffusion tensor imaging. Eur Radiol. 2007; 17:1675–1684.
crossref
2. Price SJ, Jena R, Burnet NG, et al. Improved delineation of glioma margins and regions of infiltration with the use of diffusion tensor imaging: an image-guided biopsy study. AJNR Am J Neuroradiol. 2006; 27:1969–1974.
3. Schlüter M, Stieltjes B, Hahn HK, Rexilius J, Konrad-verse O, Peitgen HO. Detection of tumour infiltration in axonal fibre bundles using diffusion tensor imaging. Int J Med Robot. 2005; 1:80–86.
crossref
4. Johnson PC, Hunt SJ, Drayer BP. Human cerebral gliomas: correlation of postmortem MR imaging and neuropathologic findings. Radiology. 1989; 170(1 Pt 1):211–217.
crossref
5. Mabray MC, Barajas RF Jr, Cha S. Modern brain tumor imaging. Brain Tumor Res Treat. 2015; 3:8–23.
crossref
6. Giese A, Kluwe L, Laube B, Meissner H, Berens ME, Westphal M. Migration of human glioma cells on myelin. Neurosurgery. 1996; 38:755–764.
crossref
7. Nilsson D, Rutka JT, Snead OC 3rd, Raybaud CR, Widjaja E. Preserved structural integrity of white matter adjacent to low-grade tumors. Childs Nerv Syst. 2008; 24:313–320.
crossref
8. Watanabe M, Tanaka R, Takeda N. Magnetic resonance imaging and histopathology of cerebral gliomas. Neuroradiology. 1992; 34:463–469.
crossref
9. Akai H, Mori H, Aoki S, et al. Diffusion tensor tractography of gliomatosis cerebri: fiber tracking through the tumor. J Comput Assist Tomogr. 2005; 29:127–129.
10. Duffau H, Thiebaut de Schotten M, Mandonnet E. White matter functional connectivity as an additional landmark for dominant temporal lobectomy. J Neurol Neurosurg Psychiatry. 2008; 79:492–495.
crossref
11. Han BS, Ahn SH, Jang SH. Cortical reorganization demonstrated by diffusion tensor tractography analyzed using functional MRI activation. NeuroRehabilitation. 2008; 23:171–174.
crossref
12. Kim CH, Chung CK, Kim JS, Jahng TA, Lee JH, Song IC. Use of diffusion tensor imaging to evaluate weakness. J Neurosurg. 2007; 106:111–118.
crossref
13. Lee HY, Na DG, Song IC, et al. Diffusion-tensor imaging for glioma grading at 3-T magnetic resonance imaging: analysis of fractional anisotropy and mean diffusivity. J Comput Assist Tomogr. 2008; 32:298–303.
crossref
14. Bastin ME, Carpenter TK, Armitage PA, Sinha S, Wardlaw JM, Whittle IR. Effects of dexamethasone on cerebral perfusion and water diffusion in patients with high-grade glioma. AJNR Am J Neuroradiol. 2006; 27:402–408.
15. Sinha S, Bastin ME, Wardlaw JM, Armitage PA, Whittle IR. Effects of dexamethasone on peritumoural oedematous brain: a DT-MRI study. J Neurol Neurosurg Psychiatry. 2004; 75:1632–1635.
crossref
16. Oldfield RC. The assessment and analysis of handedness: the Edinburgh inventory. Neuropsychologia. 1971; 9:97–113.
crossref
17. Mori S, Crain BJ, Chacko VP, van Zijl PC. Three-dimensional tracking of axonal projections in the brain by magnetic resonance imaging. Ann Neurol. 1999; 45:265–269.
crossref
18. Concha L, Beaulieu C, Gross DW. Bilateral limbic diffusion abnormalities in unilateral temporal lobe epilepsy. Ann Neurol. 2005; 57:188–196.
crossref
19. Catani M, Howard RJ, Pajevic S, Jones DK. Virtual in vivo interactive dissection of white matter fasciculi in the human brain. Neuroimage. 2002; 17:77–94.
crossref
20. Kim CH, Kim JH, Chung CK, Kim JS, Lee JM, Lee SK. Localization of broca's area using functional MR imaging: quantitative evaluation of paradigms. J Korean Neurosurg Soc. 2009; 45:219–223.
crossref
21. Hochberg FH, Pruitt A. Assumptions in the radiotherapy of glioblastoma. Neurology. 1980; 30:907–911.
crossref
22. Silbergeld DL, Chicoine MR. Isolation and characterization of human malignant glioma cells from histologically normal brain. J Neurosurg. 1997; 86:525–531.
crossref
23. Halperin EC, Bentel G, Heinz ER, Burger PC. Radiation therapy treatment planning in supratentorial glioblastoma multiforme: an analysis based on post mortem topographic anatomy with CT correlations. Int J Radiat Oncol Biol Phys. 1989; 17:1347–1350.
crossref
24. Beppu T, Inoue T, Shibata Y, et al. Fractional anisotropy value by diffusion tensor magnetic resonance imaging as a predictor of cell density and proliferation activity of glioblastomas. Surg Neurol. 2005; 63:56–61. discussion 61.
crossref
25. Goebell E, Fiehler J, Ding XQ, et al. Disarrangement of fiber tracts and decline of neuronal density correlate in glioma patients--a combined diffusion tensor imaging and 1H-MR spectroscopy study. AJNR Am J Neuroradiol. 2006; 27:1426–1431.
26. Price SJ, Burnet NG, Donovan T, et al. Diffusion tensor imaging of brain tumours at 3T: a potential tool for assessing white matter tract invasion? Clin Radiol. 2003; 58:455–462.
crossref
27. Morita K, Matsuzawa H, Fujii Y, Tanaka R, Kwee IL, Nakada T. Diffusion tensor analysis of peritumoral edema using lambda chart analysis indicative of the heterogeneity of the microstructure within edema. J Neurosurg. 2005; 102:336–341.
crossref
28. Tropine A, Vucurevic G, Delani P, et al. Contribution of diffusion tensor imaging to delineation of gliomas and glioblastomas. J Magn Reson Imaging. 2004; 20:905–912.
crossref
29. Provenzale JM, McGraw P, Mhatre P, Guo AC, Delong D. Peritumoral brain regions in gliomas and meningiomas: investigation with isotropic diffusion-weighted MR imaging and diffusion-tensor MR imaging. Radiology. 2004; 232:451–460.
crossref
30. Sundgren PC, Fan X, Weybright P, et al. Differentiation of recurrent brain tumor versus radiation injury using diffusion tensor imaging in patients with new contrast-enhancing lesions. Magn Reson Imaging. 2006; 24:1131–1142.
crossref
31. Toh CH, Wong AM, Wei KC, Ng SH, Wong HF, Wan YL. Peritumoral edema of meningiomas and metastatic brain tumors: differences in diffusion characteristics evaluated with diffusion-tensor MR imaging. Neuroradiology. 2007; 49:489–494.
crossref
32. Stadlbauer A, Ganslandt O, Buslei R, et al. Gliomas: histopathologic evaluation of changes in directionality and magnitude of water diffusion at diffusion-tensor MR imaging. Radiology. 2006; 240:803–810.
crossref
33. Stadlbauer A, Nimsky C, Buslei R, et al. Diffusion tensor imaging and optimized fiber tracking in glioma patients: histopathologic evaluation of tumor-invaded white matter structures. Neuroimage. 2007; 34:949–956.
crossref
34. Lunsford LD, Martinez AJ, Latchaw RE. Magnetic resonance imaging does not define tumor boundaries. Acta Radiol Suppl. 1986; 369:154–156.
35. Schonberg T, Pianka P, Hendler T, Pasternak O, Assaf Y. Characterization of displaced white matter by brain tumors using combined DTI and fMRI. Neuroimage. 2006; 30:1100–1111.
crossref
36. Smits M, Vernooij MW, Wielopolski PA, Vincent AJ, Houston GC, van der Lugt A. Incorporating functional MR imaging into diffusion tensor tractography in the preoperative assessment of the corticospinal tract in patients with brain tumors. AJNR Am J Neuroradiol. 2007; 28:1354–1361.
crossref
37. Kunimatsu A, Itoh D, Nakata Y, et al. Utilization of diffusion tensor tractography in combination with spatial normalization to assess involvement of the corticospinal tract in capsular/pericapsular stroke: feasibility and clinical implications. J Magn Reson Imaging. 2007; 26:1399–1404.
crossref
TOOLS
Similar articles