

 PDF
PDF ePub
ePub Citation
 Print
Print


Abstract
Purpose:
This study investigates the amputation rate within 1 year after the diagnosis of diabetic foot ulcer and its associated risk factors.
Materials and Methods:
This study enrolled 60 patients with diabetic foot ulcer. The mean and standard deviation age was 64.4±12.8 years (range, 32∼89 years); the mean and standard deviation prevalence period for diabetes mellitus was 21.0±7.5 years (range, 0.5∼36 years). The amputation rate was evaluated by dividing the subjects into two groups—the major and minor amputation groups—within 1 year following the initial diagnosis of diabetic foot ulcer. Multivariate Cox proportional hazards regression analysis was used to identify the risk factors for amputation.
Results:
The total amputation rate of 38.3% (n=23) was comprised of the amputation rate for the major amputation group (10.0%) and rate for the minor amputation group (23.8%). There was a high correlation between peripheral artery disease (toe brachial pressure index <0.7) and amputation (hazard ratio [HR] 5.81, confidence interval [CI] 2.09∼16.1, p<0.01). Nephropathy was significantly correlated with the amputation rate (HR 3.53, CI 1.29∼9.64, p=0.01).
REFERENCES
1.Boulton AJ. The pathway to foot ulceration in diabetes. Med Clin North Am. 2013. 97:775–90.

2.Singh N., Armstrong DG., Lipsky BA. Preventing foot ulcers in patients with diabetes. JAMA. 2005. 293:217–28.
3.Stiegler H. Das diabetische Fußsyndrom [Diabetic foot syndrome]. Herz. 2004. 29:104–15. German.
4.Gregg EW., Sorlie P., Paulose-Ram R., Gu Q., Eberhardt MS., Wolz M, et al. Prevalence of lower-extremity disease in the US adult population >=42 years of age with and without diabetes: 1999-2000 national health and nutrition examination survey. Diabetes Care. 2004. 27:1591–7.
5.Winkley K., Stahl D., Chalder T., Edmonds ME., Ismail K. Risk factors associated with adverse outcomes in a population-based prospective cohort study of people with their first diabetic foot ulcer. J Diabetes Complications. 2007. 21:341–9.
6.Morbach S., Furchert H., Gröblinghoff U., Hoffmeier H., Kersten K., Klauke GT, et al. Long-term prognosis of diabetic foot patients and their limbs: amputation and death over the course of a de-cade. Diabetes Care. 2012. 35:2021–7.
7.Won SH., Chung CY., Park MS., Lee T., Sung KH., Lee SY, et al. Risk factors associated with amputation-free survival in patient with diabetic foot ulcers. Yonsei Med J. 2014. 55:1373–8.
8.Faglia E., Clerici G., Caminiti M., Curci V., Somalvico F. Prognostic difference between soft tissue abscess and osteomyelitis of the foot in patients with diabetes: data from a consecutive series of 452 hospitalized patients. J Foot Ankle Surg. 2012. 51:34–8.
9.Beks PJ., Mackaay AJ., de Neeling JN., de Vries H., Bouter LM., Heine RJ. Peripheral arterial disease in relation to glycaemic level in an elderly Caucasian population: the Hoorn study. Diabetologia. 1995. 38:86–96.
10.Høyer C., Sandermann J., Petersen LJ. The toe-brachial index in the diagnosis of peripheral arterial disease. J Vasc Surg. 2013. 58:231–8.
11.Sharp CS., Bessman AN., Wagner FW Jr., Garland D. Microbiology of deep tissue in diabetic gangrene. Diabetes Care. 1978. 1:289–92.
12.Pscherer S., Dippel FW., Lauterbach S., Kostev K. Amputation rate and risk factors in type 2 patients with diabetic foot syndrome under real-life conditions in Germany. Prim Care Diabetes. 2012. 6:241–6.
13.Miyajima S., Shirai A., Yamamoto S., Okada N., Matsushita T. Risk factors for major limb amputations in diabetic foot gangrene patients. Diabetes Res Clin Pract. 2006. 71:272–9.
14.Kaminski M., Frescos N., Tucker S. Prevalence of risk factors for foot ulceration in patients with end-stage renal disease on hae-modialysis. Intern Med J1. 2012. 42:e120–8.
Fig. 1.
Kaplan-Meier curves depending on toe-brachial pressure index (log-rank test p<0.01). TBPI: toe-brachial pressure index.
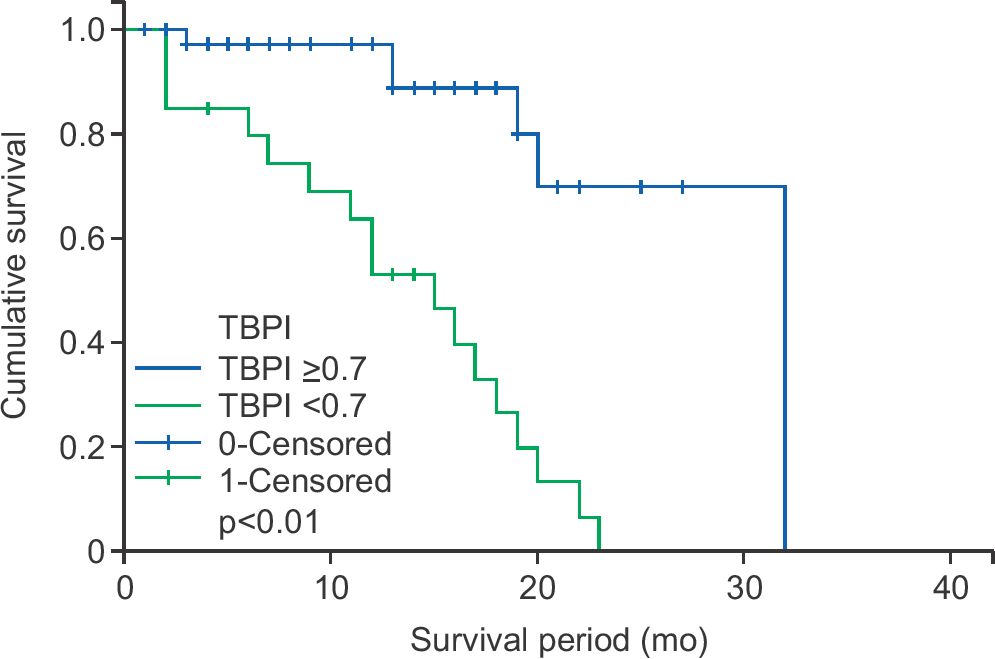
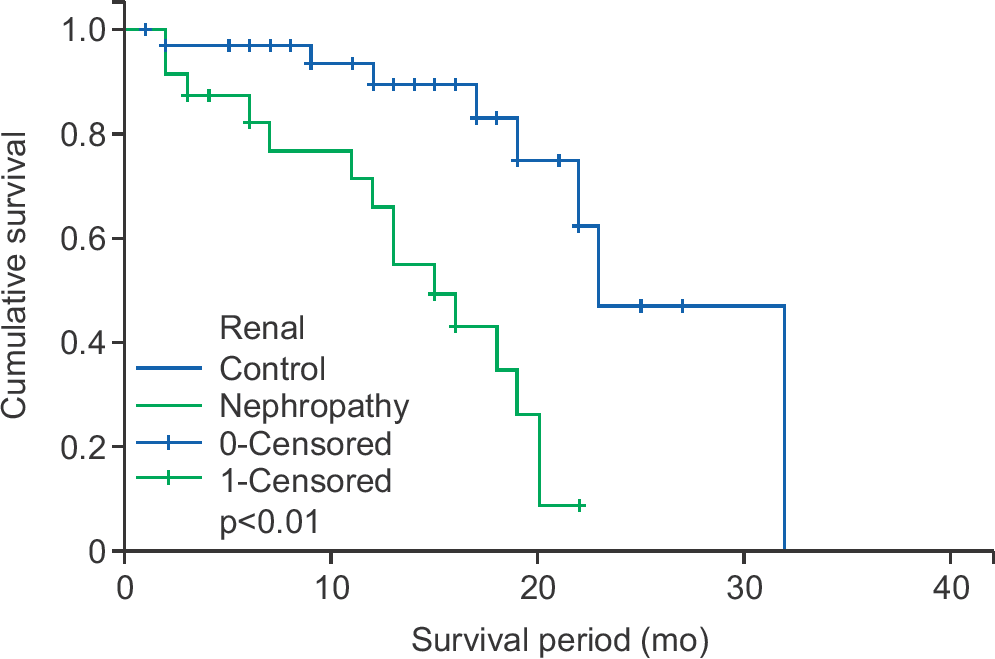
Table 1.
Demographic and Clinical Patient Characteristics
Table 2.
Univariate Cox Proportional Hazards Regression Models
Table 3.
Multivariate Cox Proportional Hazards Regression Models
 XML Download